
What’s Inside The S&P China A-Share Factor Indices? The Impact Of Style Risk Factors
In our previous blog, our studies indicated that most factor indices in China exhibited distinct return characteristics during up and down markets. To understand the sources that drive differential factor performance, we examined the risk factor exposures and factor impact on the performance of S&P China A-Share Factor Indices[1] based on the Axioma AXCN4-MH China equity factor risk factor model.
As indicated in Exhibit 1, over the period from July 31, 2006, to April 30, 2019, value, small caps, and low volatility were the best-performing risk factors in the China A-Share market. Therefore, exposures to these factors could have a significant impact on portfolio returns.
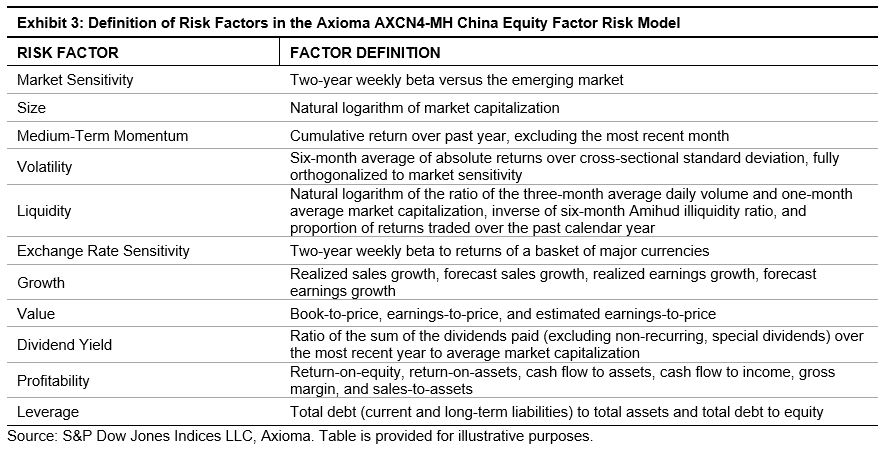
Different factor indices displayed distinct risk factor exposures (see the Appendix for risk factor definitions). All S&P China-A Share Factor Indices exhibited targeted active factor exposures relative to the eligible universe (see Exhibit 1). Unintended active factor exposures were also observed in various indices. For instance, the S&P China A-Share Short-Term Momentum Index showed strong active exposure to high volatility, expensive valuation, and low dividend yield. The S&P China A-Share Enhanced Value Index had significant active exposure toward large caps, low volatility, and high dividend yield, while the S&P China A-Share Dividend Opportunities Index displayed significant active exposure to cheaper valuation and high profitability. The S&P China A-Share Quality Index exhibited an active tilt toward expensive valuation, high dividend yield, and low beta, while the S&P China A-Share Low Volatility Index had unintended active exposure toward high dividend yield and cheaper valuation.
(Click on image to enlarge)

To understand the main drivers of portfolio performance, we decomposed the active returns of portfolios into different style risk factors, industry factors, and stock-specific risks.
As shown in Exhibit 2, over the same period, most of the underperformance of the S&P China A-Share Short-Term Momentum Index was driven by its exposure to high momentum, high volatility, and expensive valuation. Small caps was the only style factor that had significant positive impact on active returns.
(Click on image to enlarge)

As expected, the value factor was the main driver of the outperformance of the S&P China A-Share Enhanced Value Index. Its unintended exposure to low volatility and high dividend yield also had a positive contribution to its active returns.
The excess returns of the S&P China A-Share Dividend Opportunities Index were mainly driven by its targeted exposure to high dividend yield and associated exposure to cheaper valuation, low volatility, and small caps.
Consistent with the design of the quality index, profitability and low leverage contributed positively to its active returns. However, the unintended exposure to high volatility and expensive valuation generated negative return contribution historically.
Unsurprisingly, low volatility was the main source of the active returns of the S&P China A-Share Low Volatility Index. Its unintended biases to cheaper valuation and small caps had a significant contribution to its outperformance as well.
As we can see from this risk attribution analysis, different factor portfolios had distinct factor exposures, which might drive performance differently. Decomposing the source of active returns can be useful for investors to understand the behavior of factor portfolios in different market environments.
(Click on image to enlarge)
[1] All portfolio constituents are drawn from the combined universe of the S&P China A BMI Domestic and S&P China A Venture Enterprises Index except for the S&P China A-Share Dividend Opportunities Index. To ensure investability, eligible stocks must have a float-adjusted market capitalization no less than RMB 1 billion and a three-month average daily value traded not below RMB 20 million. The S&P China A-Share Enhanced Value Index, S&P China A-Share Short-Term Momentum Index, and S&P China A-Share Quality Index include the 100 stocks with the highest factor scores, and the stocks are weighted by their score-tilted market cap, subject to security and sector constraints. The S&P China A-Share Low Volatility Index includes the 100 stocks with the lowest realized return volatility, and the stocks are weighted by the inverse of volatility. The S&P China A-Share Dividend Opportunities Index includes the 100 stocks from the S&P China A Composite Index with the highest dividend yield, while meeting earnings-per-share growth criteria, with all the stocks weighted by their dividend yield. The S&P China A-Share Small Cap Portfolio is a hypothetical portfolio, which includes 100 stocks with the lowest float-adjust market capitalization, and stocks are weighted by float-adjust market capitalization. All indices were rebalanced semiannually apart from the S&P China A-Share Low Volatility Index, which was rebalanced quarterly.
Copyright © 2018 S&P Dow Jones Indices LLC, a division of S&P Global. All rights reserved. This material is reproduced with the prior written consent of S&P DJI. For more information ...
more

