Last week, most every index and index ETF was expressing overbought conditions. With all the major indices falling greater than 2% to complete the trading week, indices and index ETFs have now worked off some of their overbought conditions. (Table from Bespoke Investment Group)
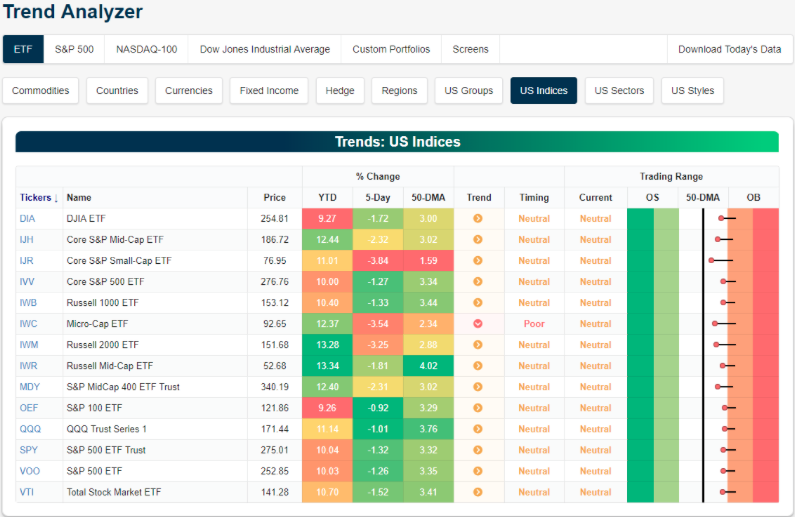
You’ll notice within the table that all index ETFs are presently expressing a Neutral trend while still trading above their 50-DMA. Recall, algos are level seekers and can be key-word triggered. It has been anticipated and/or forecast that the S&P 500 (
SPX) would find resistance at the 2,800 level and retrench thereafter. This forecast proved prescient during the trading week. The S&P 500 proved incapable of holding above this watermark level that has been resistance on 3 other occasions in late 2018.
With the aforementioned in mind and the major indices working off their overbought conditions, investors should remain with the following considerations for the coming weeks and months.
- The current set up suggests that the correction that started last week is not yet complete and any bounce will likely be a good opportunity to reposition portfolios in the short-term until a better entry point to increase market exposure is delivered by the market internals.
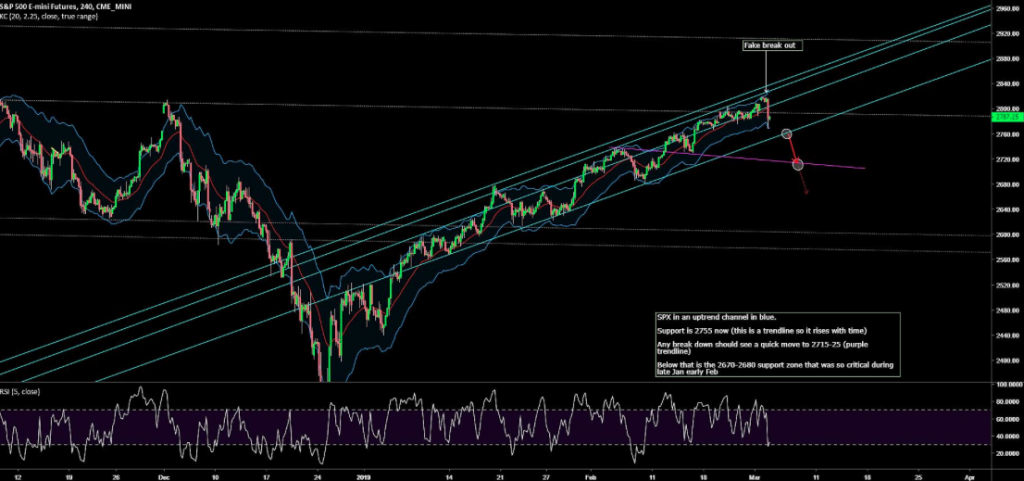
- Despite the strength into the close on Friday, SPX still put in a weekly engulfing candle, erasing 2 weeks of gains and more follow through is possible (last 2 weekly engulfing candles were Oct 1st & Dec 3). Looking higher to 2770’s first for a back test is possible before downturn resumes.
- As an investor desiring to see invested capital grow over time, we have a duty to exercise discipline to “when” and “how” we are allocating capital. This can be characterized by using a baseball metaphor: "Wait for a good pitch to hit. A baseball player must exercise patience at the plate, waiting for just the right pitch to hit. In that metaphor resides the art of patience. As an investor, the fat pitch is based on valuation. Know what something is worth, and wait for the opportunity to buy it at a lesser value than what it is worth.
- Managing a portfolio is largely about measuring risk vs. reward and measuring allocation to risk, but primarily when reward outweighs the potential risk.
- With everything up to this bullet point considered, the risk is presently higher than the potential reward in the major indices and index ETFs. In other words, there is the likelihood of better entry points in the near future.
Looking beyond the simplicity of overbought conditions, expressed across many indicators that included the NYSE A/D Line hitting an all-time high, one of the more pressing reasons a pullback was likely this past trading week was the trend in the Dow Jones Transportation Index (
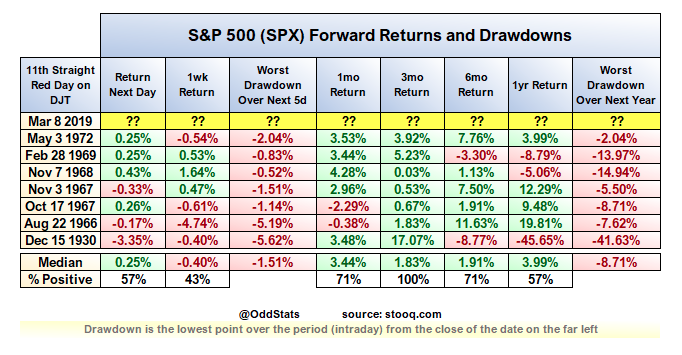
DJT). Coming into the trading week, DJT had logged 6 consecutive days of losses. By Friday of this week, the DJT produced its lengthiest series of losses since 1972, 11 consecutive trading days. The 135-year-old index has only logged 5 periods in which it declined for 11 consecutive sessions, and five points where it has registered a 12-day drop, according to Dow Jones Market Data and S&P Dow Jones Indices.
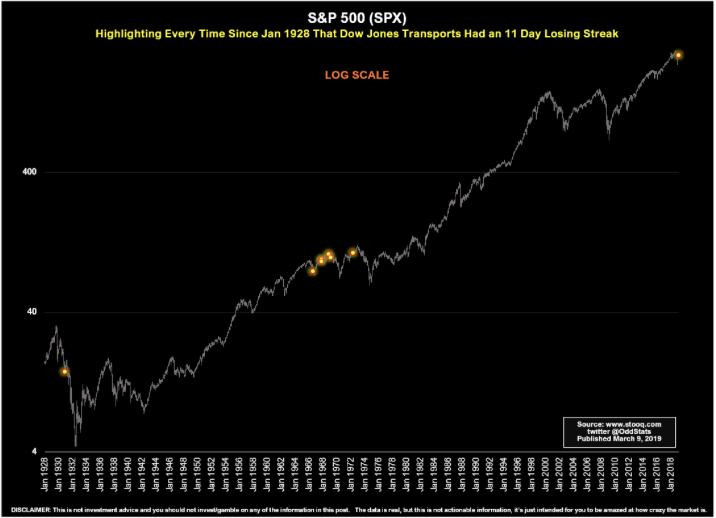
Unfortunately, as it pertains to the modern economy and markets, historical statistical probabilities about what this could possibly mean for the market going forward is more conjecture than it is reliable. Nonetheless, here are some of those statistics from when the DJT has expressed 11 consecutive sessions of losses. (Statistics provided by OddStats)
The Macro Bleakness
What the Dow Jones Transport Index is reacting to is related to the macro-headlines that ultimately underline the macro-fundamentals. Last week some of these macro factors came to the forefront in a big way, a way that reminded investors about the weakening global economy. Much of the macro-headlines that rocked markets this past week occurred Thursday and Friday.
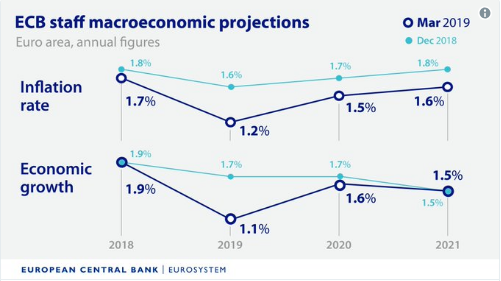
First, the European Central Bank extended its so-called forward guidance on ultra low interest rates, saying it doesn’t expect to begin lifting them until at least early 2020. This was a reaction to a weakening Eurozone outlook.
The ECB slashed their macroeconomic forecasts, including reducing the outlook for 2019 gross domestic product growth to 1.1% from a previous 1.7% and signaling that inflation will take even longer to reach the central bank’s target of near but just below 2 percent. On top of this, or second, the ECB launched its 3rd iteration of a program of cheap loans, known as targeted long-term refinancing operations, or TLTROs, to Eurozone banks.
From Thursday night to Friday morning, the next piece of global economic uncertainty was raised from China’s economy. The news out of China showed that the economy
reported a 20% drop in February exports on the heels of a 9.1% gain in January. The disappointing trade data reflect weaker global demand and distortions from the Lunar New Year holiday, said economists.
Beijing earlier this past week lowered its economic growth target this year to between 6% and 6.5 percent. In a sign of worsening domestic demand, imports fell 5.2%, extending January's 1.5% drop. Imports fell 3.1% over the first two months.
Analysts have cautioned that the data from China at the beginning of the year may be distorted by weeklong Chinese New Year public holidays, which started in early February this year. In 2018, Chinese New Year holidays started in mid-February. China is currently in the midst of a two-week annual parliamentary meeting, the National People’s Congress, which kicked off on Tuesday and ends next Friday (Mar. 5-15).
At the National People’s Congress this past week, Chinese Premier Li Keqiang said on that risks threatening the world’s second-largest economy may warrant “stronger mitigating action” as growth is expected to slow further this year. So what exactly is China doing to stimulate their economy you might be asking:
- Li announced cuts in taxes and fees worth nearly 2 trillion yuan ($289.28 billion). In particular, the premier said the value-added tax rate for the manufacturing sector will be reduced from 16% to 13%, while the duty for transportation and construction will be cut from 10% to 9 percent.
- In addition, Li announced plans to increase the country’s infrastructure financing: Around 2.15 trillion yuan worth of local government special bonds will be issued this year to meet spending needs for key projects. A special bond is a type of debt asset, which Beijing created after an earlier crackdown on non-bank lending, so projects such as railways and roads can still secure funding.
The latest from China’s stimulus only validates the already active central banks around the world, which have largely turned dovish and are foregoing rate hikes in 2019. As it pertains to the U.S. and its central bank committee (FOMC), there is an increasing probability that the next action out of the FOMC is proposed to be a rate cut rather than a rate hike. To determine this we look toward the Fed Fund contracts/probabilities via the CME FedWatch Tool.
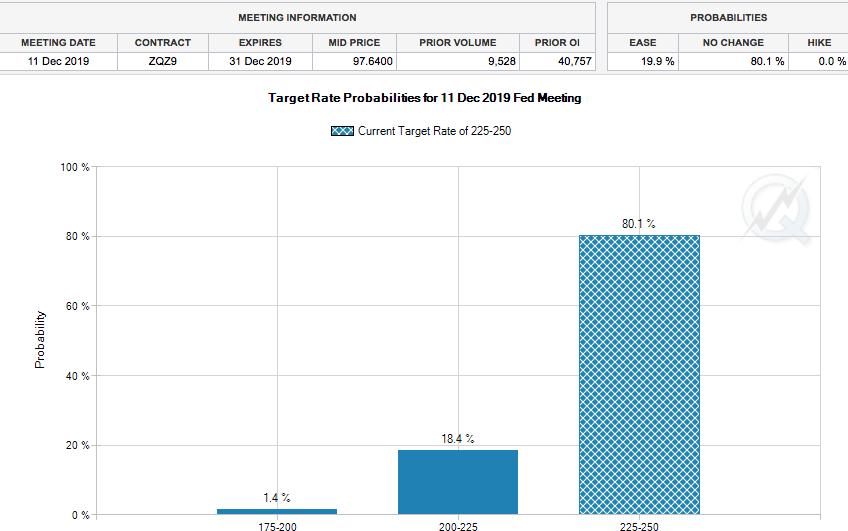
The current Fed Funds target rate is 225-250. The FedWatch tool suggests that there is no probability of a rate hike beyond 250 in 2019, but an 18.4% probability of a Fed rate cut by year’s end. To the extent the Fed may have intended to cool the economy down from its sugar high in mid-2018 and where inflation seemingly ticked higher, it appears as though it has done its job. Next week, we’ll achieve some data points regarding inflation by way of the Producers Price Index and the Consumers Price Index. Both are expected to show cooling off of price reflation.
U.S. Dollar Adverse Implications from Macro
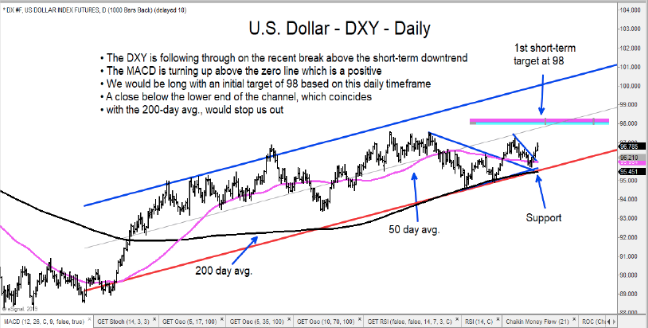
If we put all the macro-fundamental considerations together and juxtapose them with the S&P 500 earnings outlook, the most immediate consideration on those earnings is the strength in the U.S. Dollar Index (DXY). Where many economists were counting on a weakening DXY in 2019, the weakening outlooks for Europe and Asia are supplying a headwind to the Dollar forecast. This will serve to pressure the outlook for S&P 500 EPS estimates. ( Will be discussed further in the earnings segment of Research Report)
From a technical perspective, the DXY is trading bullish. Last week’s surge in the DXY put it above the 50-DMA once again.
While the near-term macro-fundamentals have provided a tailwind to the DXY, which negatively affects S&P 500 EPS, there still remains the potential for additional macro issues to unwind the DXY bullish trend. Some of those macro issues are still unresolved and include the following:
- If there's an extension date or a win in the China trade feud for the Trump Administration.
- Prime Minister May gets approval for a Brexit extension or a Brexit compromise is agreed to between the U.K and the European Union.
- The poor global PMI results in early 2019 give way to improvements in the manufacturing data by spring 2019.
Speaking of PMI data, we are forced to recognize that global PMI data has been weakening since late 2018. As such, it’s no coincidence that global equity markets have corrected since then and may do so near-term, once again. The chart of the S&P 500 and Global PMIs below is as much an indicator of market probability as anything else.
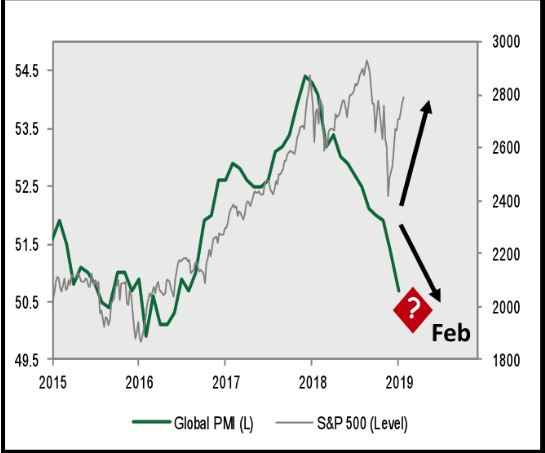
The shift towards easier financial conditions in Europe, Asia, and the U.S. suggests that the aforementioned PMI number data that has plummeted in 2019 may stabilize before summer. Until then, however, it will be a cautious outlook from the investor class that likely finds the U.S. Dollar as a safe haven.
As it pertains to manufacturing, you might be wonder just how big
manufacturing is as a percentage of GDP in the United States. It’s actually not that big and has been increasingly less significant with each passing decade.
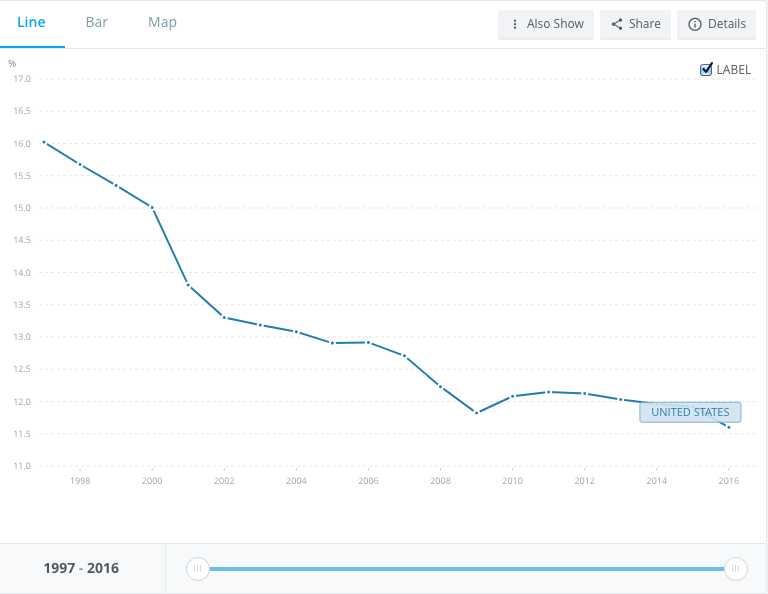
Unfortunately, the world’s second largest economy is China and China’s manufacturing sector accounts for over 30% of the country’s GDP. At present, that is why China’s stimulus is aimed at the manufacturing sector and lending activities that support the manufacturing sector.
Economic Data Is Mixed
There was some surprises in the economic data this past week; some of the data surprised to the upside and some to the downside. On the positive side of the data spectrum was the housing data.
Builders broke ground on more homes and applied for more permits to start construction in the future, a solid vote of confidence in economic growth and a surge of much-needed inventory for the supply-starved housing market. Starts were 19% higher than in December and 7.8% lower than year-ago levels. Permits were 1.4% higher than in December and 1.5% lower than last year.
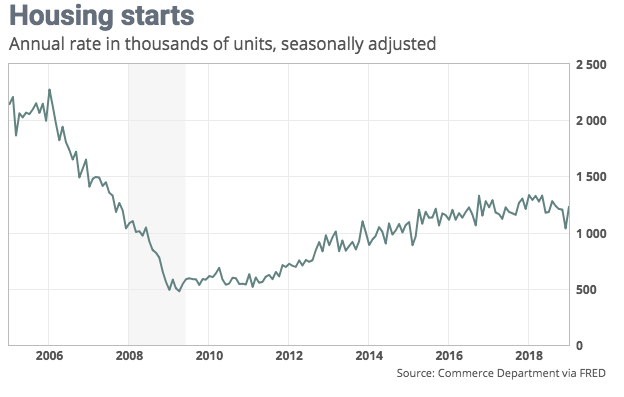
“The rebound in starts reverses the December plunge, which likely was due to a combination of weather effects and homebuilders’ nervousness as the stock market tanked; the numbers hugely overstated the softening in the market,” said Ian Shepherdson, chief economist for Pantheon Macro “sales are
now picking up, and the mortgage applications data point to further gains ahead, so single-family construction should creep higher. The multi-family numbers are wild, but the trends are flat. Housing isn’t booming, but neither is it rolling over, and it isn’t going to drag down the rest of the economy.”
When it comes to the housing market, there are two main issues that have resulted in a potential 2018 peak in the housing sector. The first issue surrounds household demographics. Millenials are forming households at slower rates than previous generations. They are bouncing around from job-to-job more so than any other generation in the past and therefore more inclined to rent than to own a home. This, combined with student loan debt and weak credit profiles has resulted in an entire generation adversely impacting an otherwise healthy housing sector.
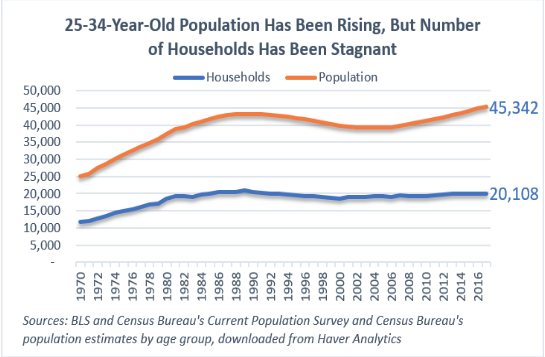
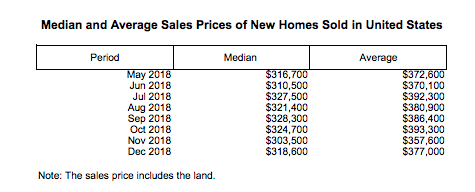
Mortgage rates have come way off of their peaks in 2018, but the median home price remains less attractive to millenials than renting at current home prices. Prior to the financial crisis, the median home price in the U.S. was around $250k.
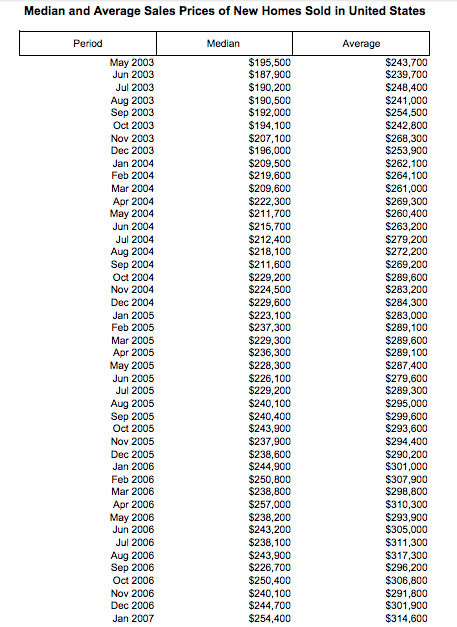
The median home price has since grown out of the Great Financial Crisis to above $300K.
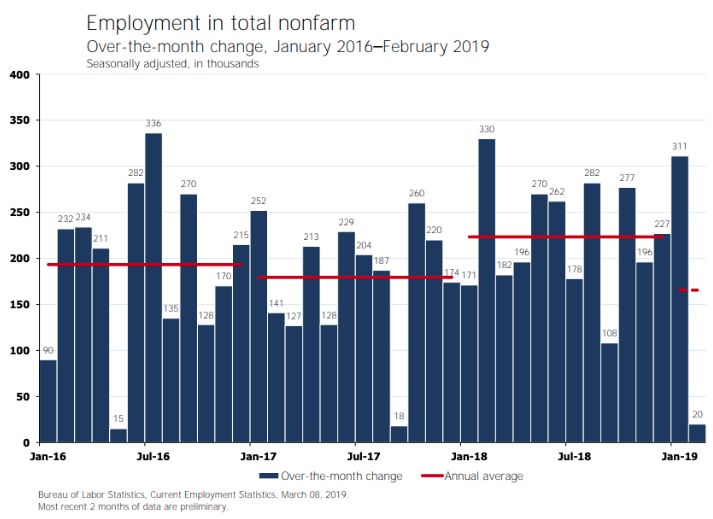
But with all of that being said concerning the housing sector; the main issue surrounding economic data this past week was the Nonfarm Payroll data. Like the most recent monthly retail sales data, it seems as though the Nonfarm Payroll data suffered from aspects of the government shutdown and/or seasonality factors. Or… it could just be the normalization of the data from what were consecutive monthly 300K prints in the data. We won’t know for sure which one it was until we are confronted with the inevitable revisions of course. With that being said…
The economy added just 20,000 new jobs last month, the smallest gain since September 2017, the government said Friday. The number of new nonfarm jobs created last month was well below the 180,000 economists forecast. The U.S. has been adding more than 200,000 new jobs a month for the past year.
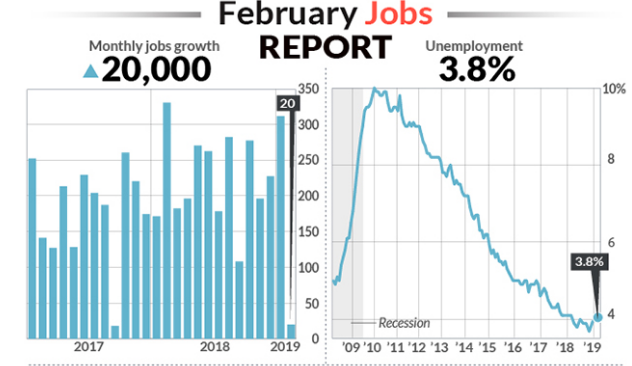
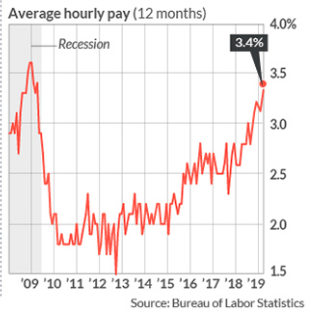
The jobless rate slipped to 3.8% from 4%, aided by the return of government workers after the end of the partial federal shutdown in January. The amount of money the average worker earns jumped 11 cents an hour to $27.66 last month. The increase in pay in the past 12 months climbed to 3.4%, the biggest gain since the end of the last recession in 2009.
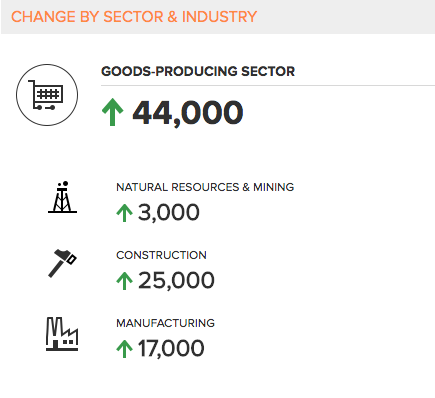
The biggest drop-off in hiring in February took place in construction, where employment fell 31,000 after a 53,000 increase in January. The sharp swing in construction employment is likely evidence that government statisticians had trouble with seasonal adjustments. This seasonal and tracking issue can be easily validated by way of the ADP private-sector payroll report, issued just 2 days prior to the Nonfarm Payroll report. (See Screenshot of sector growth within ADP report)
As it was with the monthly retail sales report from last month, showing that Nonstore retail sales fell during the December period, there is an equal impossibility in the latest Nonfarm Payroll report regarding the construction employment tracking. Something is definitively amiss in the Nonfarm Payroll data and will likely reveal itself within the next set of revisions. But until then, there will likely also remain an element of scrutiny and uncertainty amongst investors and as it pertains to the economic data.
The concerns surrounding the latest Nonfarm Payroll and the correlated bearish commentary on the economy are nothing new. There were two other months with lower job creation in this recovery/expansion cycle.
In May of 2016 Nonfarm Payrolls grew only 15K jobs. Then we saw 15 months in a row of at least 100k jobs created. In September of 2017 Nonfarm Payrolls grew only 18k jobs. Then we witnessed 16 months of at least 100k jobs created. In part, this may have been why the market recovered almost all of its losses in Friday’s trading session. But from a technical perspective, it is important to note that while the S&P 500 rallied into the closing bell, it still managed to finish the week below its 200-DMA and lower 5 days in a row. There’s good and bad in every rally; a bullish close on the day does not necessarily equate to a bullish weekly close.
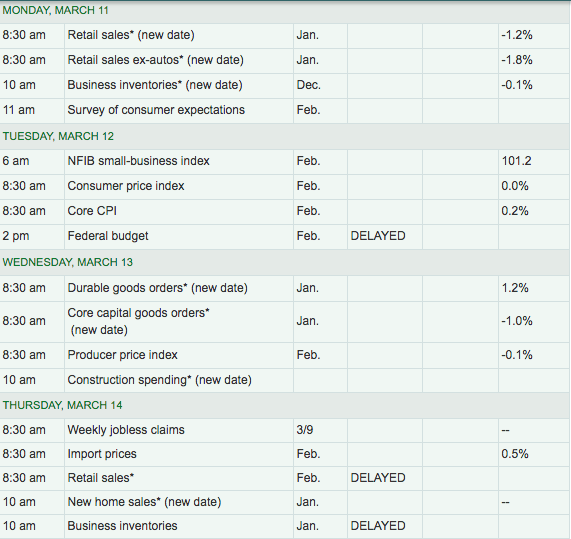
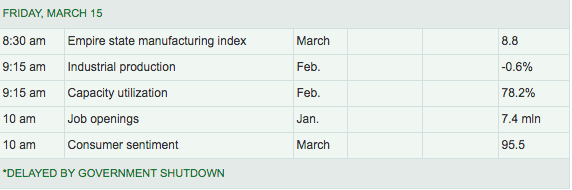
*For the coming week, investors will kick-off the weekly economic data cycle with that all too important monthly retail sales data (Monday 8:30 a.m. EST). After a 1.2% MoM, December retail sales decline (up 2.3% YOY), investors desire to see an upward revision to the December data. Below is a table from MarketWatch, outlining the weekly economic data releases.
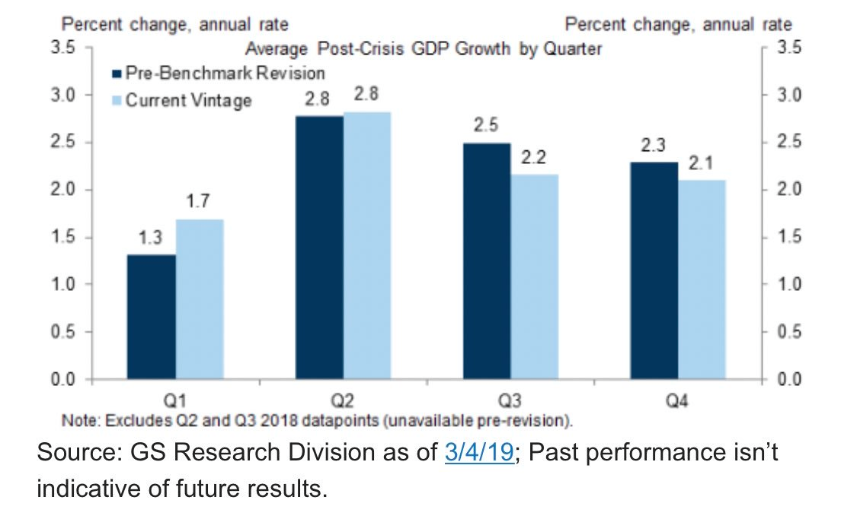
The United States is largely a consumer and services oriented economy and as such, the labor and employment data within the ISM nonmanufacturing index suggests those sectors of the economy remain in expansion and growing into 2019. The initial jobless claims combined with the JOLTs data also suggests that while the manufacturing and housing sectors of the economy have cooled, jobs are abundant and found with elevated pay scales. Taken together, these are ideal offsets for where the temporary weakness in the economy is found. While Q1 GDP will likely be depressed, we would be of the opinion that economic output will accelerate thereafter. Current estimates for Q1 GDP from the Atlanta Fed forecast GDP to come in at .5%, but will undergo a series of weekly revisions. Goldman Sachs recently updated their GDP forecast as depicted below, which seems on the high side for Q1 and will likely also undergo further revisions.
Fund Flows Matter
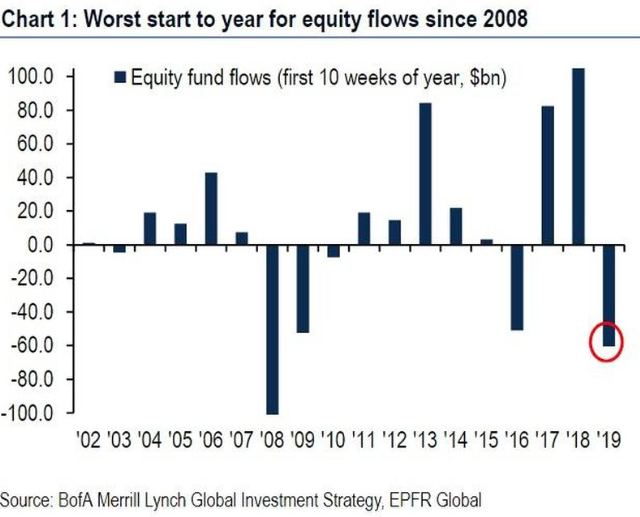
During the 10-week market rally that found selling pressure in its 11th week, fund flows have been decisively negative. Citing data from flow-tracker EPFR, BAML’s analysts calculated that just over $60 billion has now been yanked out of equities this year. Almost $80 billion has been pulled from developed markets, while $18.5 billion has gone into emerging markets.
They added that last week also saw the fourth-biggest inflow on record into ‘investment grade’ bonds at $9.5 billion and that “Europe = Japan”, a reference to long-term anemic growth and low-interest rates, was now the most consensus trade in the world by their calculations.
Moreover, in spite of the market rally and abating fears about imminent economic recessions around the globe, ETF positioning shows investor aversion to cyclical sectors is at extreme levels.
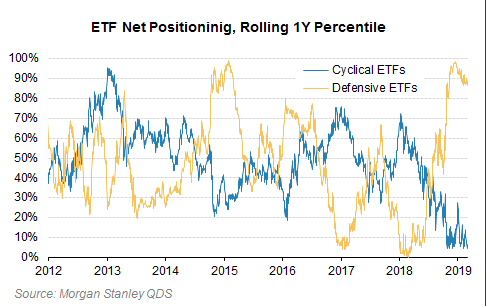
There are many indications and definitions we can extrapolate from fund flows. Based on the charts above, we are forced to recognize that much of the recent market rally was found with low volumes and defensive posturing rather than positioning with and for growth. And who is taking advantage of the recent market rally: The same investors who took advantage of the 2018 market swoon, insiders!
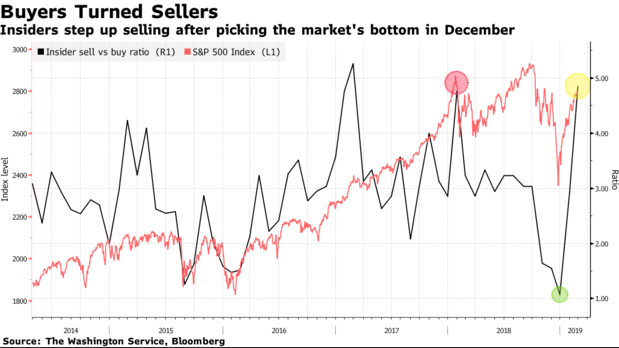
Last month,
insider sellers outpaced buyers by a ratio of 5-to-1, the most in two years, data compiled by the Washington Service showed. More than 2,600 insiders dumped shares last month, up from 1,360 in December. At the same time, only about 540 executives bought, less than half the number seen two months ago.
Once again, if we take all the aforementioned fund flow data under consideration we come to rationalize the likelihood that the market’s momentum was bound to come under pressure, even with corporate buybacks accelerating through early 2019.
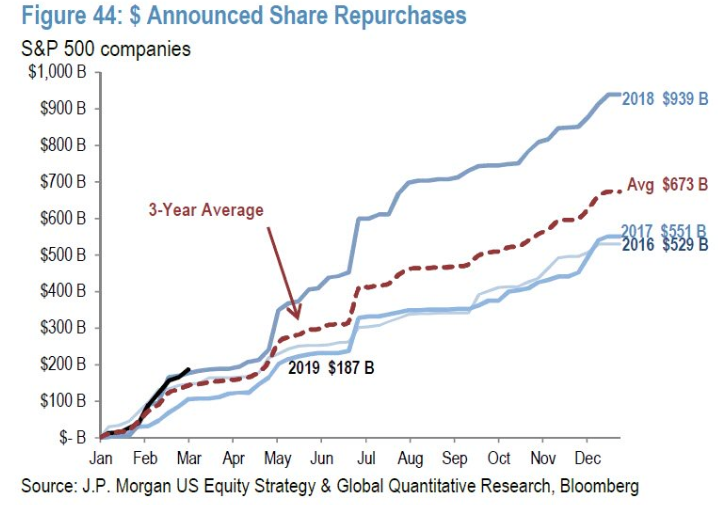
Buybacks are getting a bad wrap in the “politicalsphere” of late. But as it pertains to the investor class, the most recent annual surge in share repurchases didn’t lend any support to the market in 2018. So while buybacks are expected to loom large once again in 2019, we wouldn’t necessarily lean on this variable to support a positive market outlook. For the market to move above and beyond the current level, earnings will need to be the key driver of the market.
Earnings Outlook
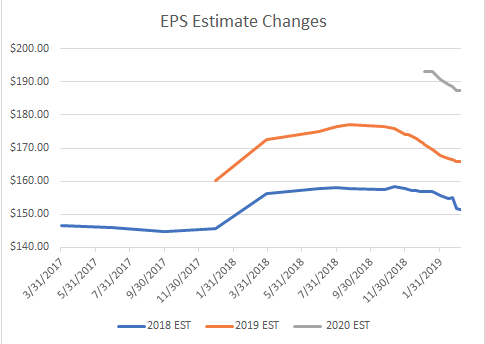
This week’s latest data is out from Dow Jones S&P; it shows that earnings, at least for this week, have stabilized, falling only slightly versus last week. Forecasts for 2018 now stand at $151.55 versus $151.60 last week. The earnings for 2019 have dropped to $166.00 from $166.06, while 2020 have fallen to $187.33 from $187.40.
The forward four-quarter (19Q1 – 19Q4) P/E ratio for the S&P 500 is 16.4. During the week of Mar. 11, 6 S&P 500 companies are expected to report quarterly earnings.
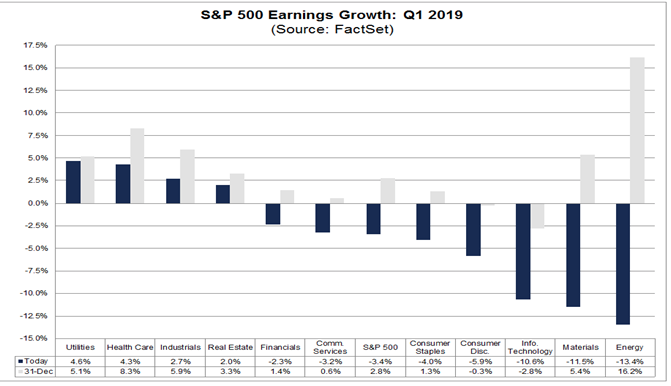
When we review FactSet’s latest Q1 2019 S&P 500 EPS forecast, we come to find the firm now expects EPS to fall 3.4% for the period. This compares with a forecast for a decline of 3.2% in the previous week.
*What continues to weigh most heavily on the earnings outlook is undoubtedly the strength of the U.S. Dollar.
- For companies that generate more than 50% of sales inside the U.S., the estimated earnings growth rate is 1.0%.
- For companies that generate less than 50% of sales inside the U.S., the estimated earnings decline is -11.2%.
- The estimated revenue growth rate for the S&P 500 for Q1 2019 is 4.9%. For companies that generate more than 50% of sales inside the U.S., the estimated revenue growth rate is 6.5%. For companies that generate less than 50% of sales inside the U.S., the estimated revenue growth rate is 0.7%.
Final Thoughts
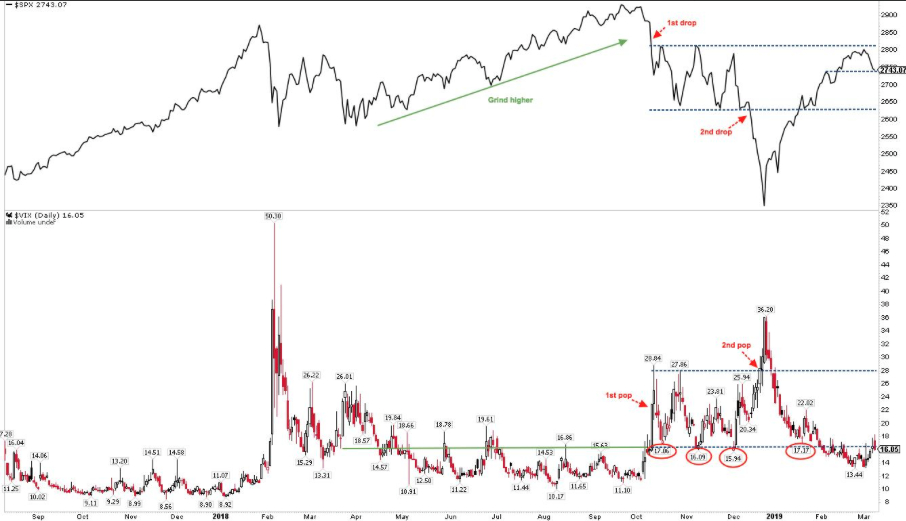
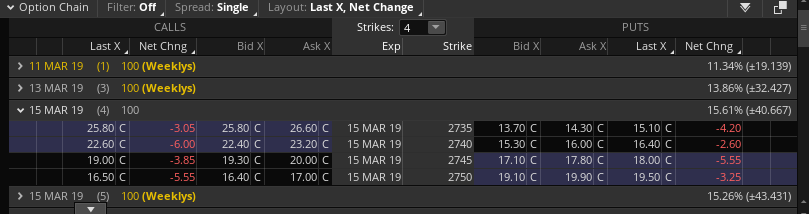
The coming trading week is anticipated to express greater volatility than previous weeks. The expected weekly move for the S&P 500 is already adjusting for an increase in implied volatility that has been priced into the market this past week with the VIX rising from 13s to over 16. For the coming week, the S&P 500 expected move is $41/points, greater than the previous week’s $33/point expected move that was breached.
The thematic architecture of this week’s Research Report focuses on what we believe will find a market with continued resistance around SPX 2,800 and investors rebalancing until Q1 2019 EPS results are delivered. By rebalancing risk in favor of minimizing exposures, the worst that can impact investors is failure to benefit from upside opportunity near-term.
Macro concerns remain front of mind with investors, as central banks have taken to lowering their respective regional GDP estimates amid geopolitical strife. While central banks have lowered their growth forecasts and turned in favor of more accommodative monetary policies, the delta between the current rate of growth and improved regional growth is uncertain. As such, investors will be monitoring economic data that much more closely in the coming weeks and months to gauge improvements or weakening in the data.


