
What Does History Tell Us About Weak Profiles Near The 200-day?
NOT ALL MOVES ABOVE THE 200-DAY ARE CREATED EQUAL
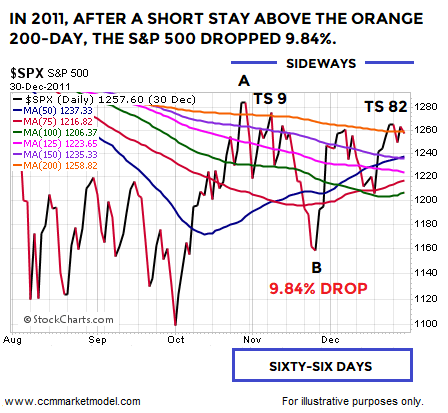
As the historical examples below clearly demonstrate, after a plunge in the stock market and within the context of a still weak long-term trend profile, seeing the S&P close above its 200-day moving average is far from an “all clear” signal. As covered in recent CCM weekly videos and shown below, the S&P 500 traded above its 200-day after making a low in October 2011.
(Click on image to enlarge)

WEAK TRENDS AND MOVES ABOVE THE 200-DAY
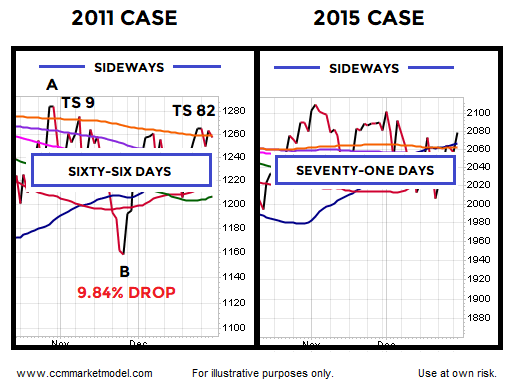
The CCM Trend Strength Model is a major component of the CCM Market Model. Trend strength scores are based on 207 binary questions using data from multiple timeframes. In late October 2011, the S&P 500 closed above a flattish 200-day moving average. However, the trend strength (TS) score was only 9 on a scale of 0 to 100, with 100 being the strongest. With a TS score of 9, the S&P 500 failed to hold above the 200-day and subsequently dropped 9.84%. The TS score of 9 told us the market’s longer-term trend still had some work to do before allowing for a more favorable risk-reward setup. When the market was ready to put together a sustained rally, the TS score was sitting at 82 in late December 2011.
(Click on image to enlarge)
TRENDS TYPICALLY NEED TIME TO FLIP
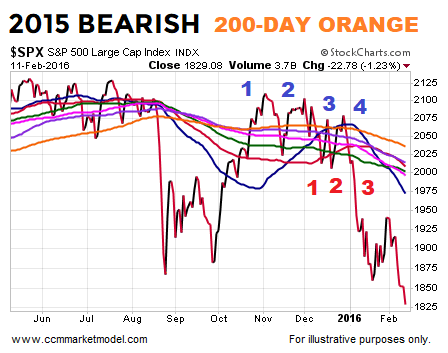
A similar situation occurred following a plunge in 2015; the S&P 500 rallied sharply back to the 200-day moving average.
(Click on image to enlarge)
CLOSER LOOK AT 2015 CASE
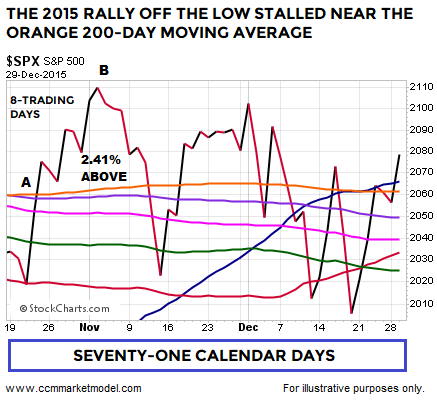
The initial push above the orange 200-day in 2015 was marked by eight trading days of gains before the market started to drop back toward the moving average cluster (chart below). The S&P 500 closed 2.41% above the point where it crossed the 200-day, telling us short stays and relatively tame moves above the 200-day are not necessarily “everything is fine” signals. Price stayed near the 200-day for seventy-one calendar days.
(Click on image to enlarge)
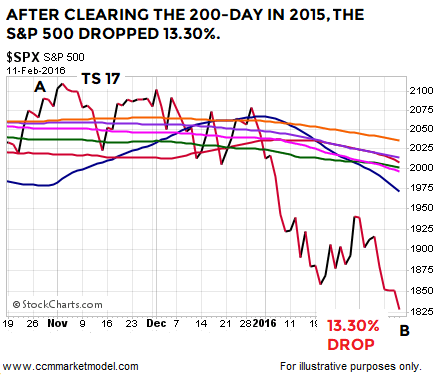
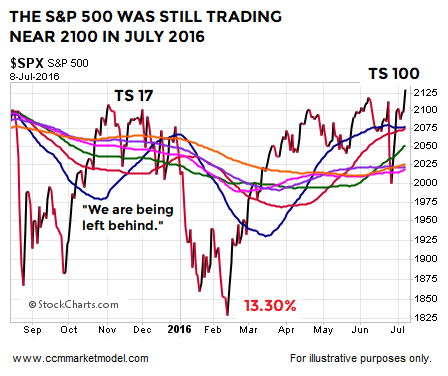
Similar to the 2011 case, the initial push above the 200-day occurred within the context of a relatively weak TS score of 17. From the highest close above the 200-day in early November 2015, the S&P 500 dropped 13.30% and exceeded the previous plunge low that was made in 2015. Notice how the S&P 500 was trading near 2100 in November 2015.
(Click on image to enlarge)
WEAK PROFILES CAN LEAD TO SIDEWAYS MOVEMENT
While it would have been easy to say “we are going to be left behind” as the S&P 500 rallied sharply off the initial plunge low in 2015 and made it all the way back to 2100, the market was still trying to clear 2100 in July of the following year. When the market was in a position to put together a more stable and sustainable rally (left side below), the TS score was sitting at 100, which is quite a bit more attractive from a risk-reward perspective relative to the TS score of 17 after the first push above the 200-day in 2015.
(Click on image to enlarge)
FAVORABLE RISK-REWARD SETUPS VS. UNFAVORABLE SETUPS
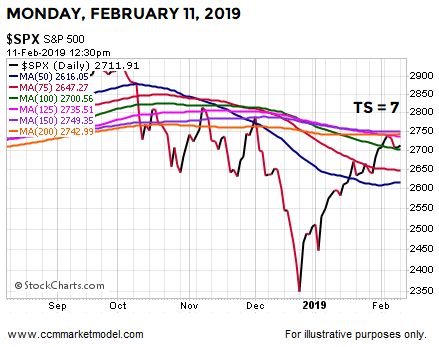
TS scores cannot predict the future; they simply help us assess the odds of good things happening on a longer-term basis relative to the odds of bad things happening on a longer-term basis. Does the 2019 TS score look more like the “take a measured approach” scores of 9 and 17 that were present before rallies failed in 2011 and 2015 or does the present score look more like the “this is a much more attractive risk/reward profile” scores of 82 and 100 that were present before satisfying and sustained moves higher in the stock market? The S&P 500’s TS score during the trading session on Monday, February 11, 2019, was 7, which is much more in line with the “take a measured approach” scores.
(Click on image to enlarge)
UPDATING SIMILAR HISTORICAL SETUPS
This week’s stock market video updates recent historical cases covered in previous videos. The video opens with a review of some of the most significant corrections and bear markets, allowing us to better understand what is in the realm of possibility over the next twenty years.
SPEAKS TO NEXT FEW MONTHS RATHER THAN NEXT FEW DAYS/WEEKS
Q: With a TS score of 7, is it possible the market continues to rally sharply and confidently moves above the 200-day moving average?
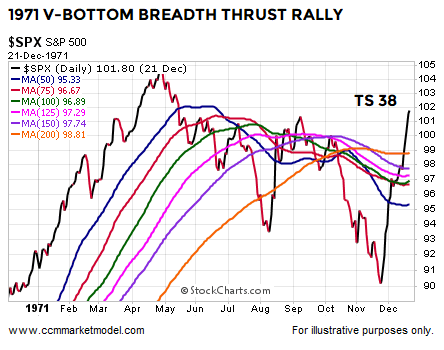
A: Yes, anything is possible in the markets and we are prepared for all outcomes from wildly bullish to wildly bearish. The TS score speaks to risk-vs.-reward. A recent similar breadth thrusts piece covered a V-bottom that occurred in 1971. In the 1971 case, the S&P blew through the 200-day and never looked back. The TS score after clearing the 200-day was 38, which is still considerably higher than the score of 7 we are seeing today. The moral of the 1971 story is we should be open to and prepared for bullish outcomes near the 200-day in 2019.
(Click on image to enlarge)
Q: Will the 2019 rally fail soon?
A: Under our approach, it is best to take it day by day with an open mind and see how the data evolves over time. Even in a giveback or retest scenario, the 2011 and 2015 cases remind us the market could trade near the 200-day for several weeks before anything is resolved.
(Click on image to enlarge)
Q: What is the key point relative to our approach to the markets?
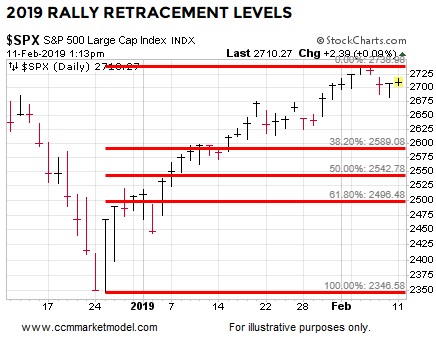
A: The key takeaway for us is making prudent risk-reward decisions with our hard-earned capital. The S&P 500’s 200-day moving average is sitting at 2743. Anecdotally, an S&P 500 push 2.41% above the 200-day, similar to 2015, would land at 2809. From that point in 2015, the S&P 500 dropped 13.30%. Even a 50% retracement of the V-move off the December 2018 low would mean a giveback of 6.2%; a move back to the 61.8% level would mean an S&P 500 drop of 7.90%. A full retest of the December 2018 low could mean a drop somewhere in the neighborhood of 13%.
(Click on image to enlarge)
With a TS score below 10 and a still yet-to-be-determined outcome near the S&P 500’s 200-day, we will continue to take a prudent, patient, and measured approach. We will continue to scale in at a rate in line with the rate of improvement in the hard data. If the data begins to improve at a faster rate, we will begin to take larger incremental steps.
Disclaimer: The opinions in this document are for informational and educational purposes only and should not be construed as a recommendation to buy or sell the stocks mentioned or to solicit ...
more

