
What Are The Risk Factors For AEP, CPN, D, SO, EXC, NEE, DUK, NRG, TVC, ETR, And More This Winter?
Going into the winter, the key variables that drive the profitability of a generation portfolio will be the price of Henry Hub, Basis, and Weather. Our Winter Power Outlook dispatches the entire N. America power system. Every asset is modeled. We have pulled together the top 10 generating portfolios under our 50+ cases to show you the impact of those variables. The information is not perfect in the sense that we do not know exactly what they have hedged or not hedge – nor do we adjust for any potential bi-lateral deal. However, the output represents the free market performance which will indicate key risk factors in how their portfolio will perform. If you have a particular set of assets or just one unit you are interested in, we can pull that information for you.
Expectations on Henry Hub are narrowed around $4/mmbtu. However, last winter, we saw Henry Hub climb to over $6/mmbtu in the winter. Running over 28 simulations of Henry Hub, the redacted (sign up to receive the Winter Power Outlook to get all the data behind each figure) figure below shows the impact of the 10 generation portfolios.
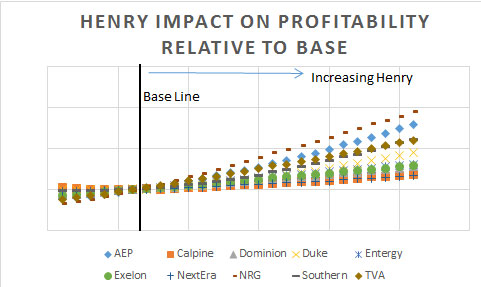
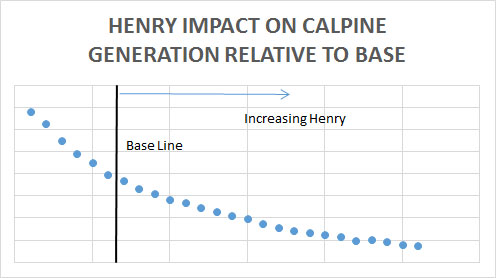
The most sensitive to the price of Henry Hub is NRG followed by AEP. NRG could potentially see an upside of almost 100% if Henry Hub prices move to our higher end range. The least impacted by changing Henry Hub are NextEra and Calpine fleet. The Calpine slope is interesting as it seems somewhat counterintuitive. Examining Calpine fleet shows that they have the lowest gas heat rate (efficiency of plant – low HR= highest efficiency) fleet ~7.8 mmbtu/MW. In addition, their fleet is 90+% gas compared to the next highest at 60%. The combination does not help them if gas prices were to stay low. Their units do generate more as the gas prices go down, but this does not lead to greater profitability – see figure below. The good news for the generating assets is the slope of profitability is asymmetrical – more upside than downside. This logic has supported some lack of action to hedge power. However, there is always a point where some hedging would be logical particularly for regulated assets and those trying to manage earnings expectations. AEC can help identify those points.
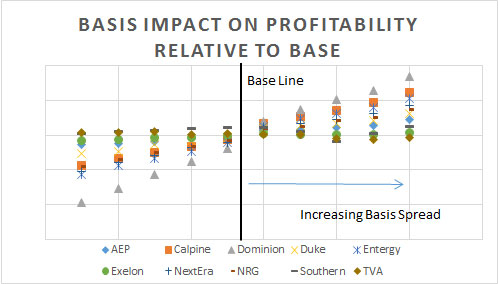
Reviewing the basis impact shows the risk reward as being much more symmetrical. The redacted figure below shows Dominion generating portfolio seeing the most impact if basis were going to change followed by Energy. This makes sense for both given their exposure to the east basis. The least impacted by basis change are TVA and Exelon. Given this knowledge, Dominion and Energy should be trading/hedging themselves for basis risk.
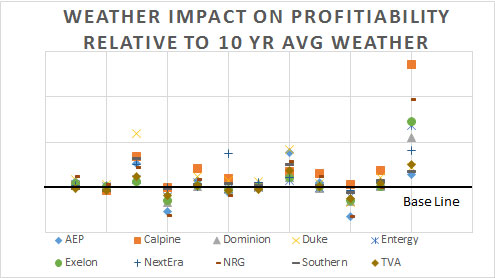
In terms of weather risk, we ran the last 12 years weather pattern in our models and compared it to the 10 year average. The following redacted figure was produced. In terms of weather risk, it is also very asymmetrical as in Henry Hub. In general, there is more upside on a cold winter than downside on a warm winter. However, in AEP’s case, that difference is very narrow given the historical weather pattern. They almost have as much to lose on a warm winter as they can gain on a cold winter. Calpine can produce the greatest gain if weather were to duplicate last year’s pattern. The fleet with the smallest standard deviation from the 10 year average weather pattern was Southern. This makes sense given the geographical location.
Disclosure: None.


