
What A Time For Consumers
We are beginning to see the spike in consumer confidence and spending that should last throughout the spring and summer. This will be the greatest spurt in spending in decades. It’s a very big deal. Firstly, Redbook yearly same store sales growth in the week of March 27th rose from 9.4% to 9.8%. This data series is volatile. Sometimes it gives off a wild reading. However, we have other data backing up the cyclical improvement. Chase card spending growth in the week of March 26th was 3.2% below its pre-COVID-19 trend which is near the high end of growth since the pandemic started. Year over year growth reached 64.6% because of the extremely weak comps. There was a massive spike in Consumer Confidence in March. We knew this would happen because stocks are rising, the economy is reopening, job creation is exploding, the Fed has rates at 0%, and the government just gave out $1,400 checks. It doesn’t get better than this.
(Click on image to enlarge)
Source: Twitter @Not_Jim_Cramer
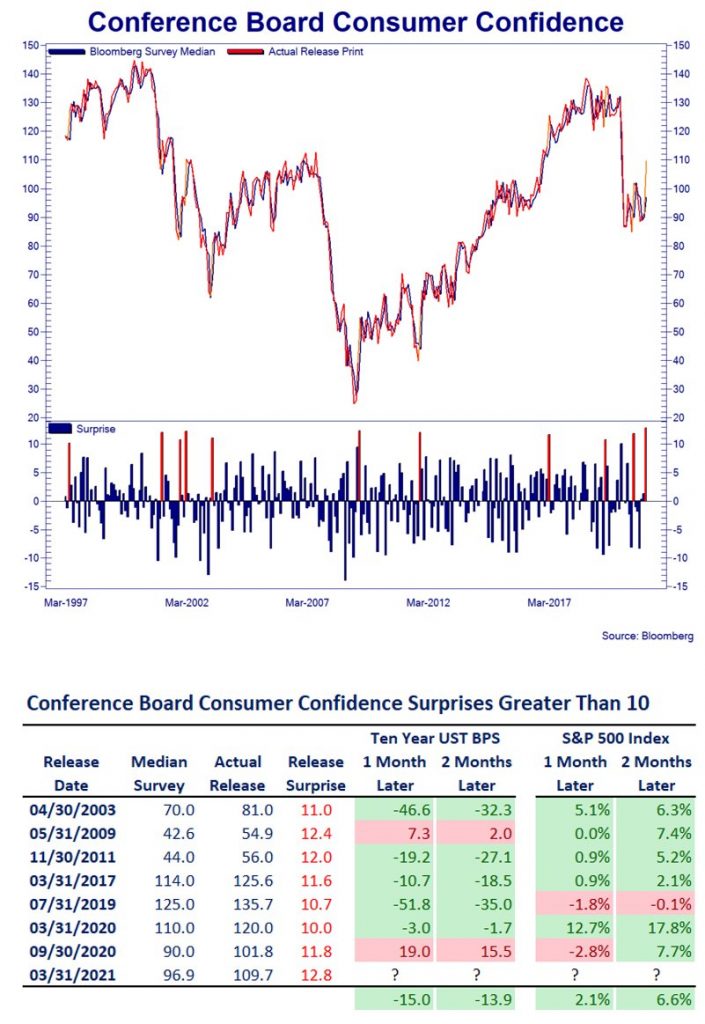
The Conference Board consumer confidence index rose from 90.4 to 109.7 which is its highest reading in 1 year. As you can see from the chart above, this was the best beat in the history of this survey. Typically, the 10-year yield is 13.9 basis points lower after such large beats. That being said, this survey was started in 1997. Since then, rates have been falling. The S&P 500 rises 6.6% on average in the following 2 months after such large beats. Sometimes good data leads to weak stock market results, but these are just beats. It’s possible large beats line up with the beginning of cyclical phase changes. That’s certainly the case now. Consumers are coming out of hibernation and they have money to spend.
The spike in the present situation index was enormous. We can’t underemphasize how big this jump was. It rose from 89.6 to 110. Expectations also rose as the index as up from 90.9 to 109.6. Consumers’ assessment of the labor market increased dramatically. This is in line with our expectation for a great BLS report this Friday. The percentage of consumers saying jobs are plentiful rose from 21.6% to 26.3% and the percentage saying jobs are hard to get fell from 22.4% to 18.5%. Expectations for business conditions jumped considerably. We don’t usually see such large spikes. This is truly the 2nd spike the economy needed to get back to its pre-pandemic trajectory. The percentage of consumers expectating business conditions to improve in the next 6 months rose from 30.7% to 40.8%. The percentage of consumers expecting business conditions to worsen fell from 17.7% to 11%.
Policy Is The Hottest Ever
As we have been saying for a couple of months now, the combination of expansionary monetary and fiscal policy is unprecedented. Combine that with an economic reopening where the top 40% spend the money they saved up in the past year. This summer will have the hottest economic data points in years. It will be studied in the history books for decades to come. The chart below aims to quantify the size of the fiscal and monetary stimulus. As you can see, the annual growth in the U.S. money supply in excess of nominal GDP growth combined with the U.S. federal deficit is the highest ever.
![]()
We beat the WWII era. It’s arguable that the government went overboard in the past few months because consumers weren’t leveraged prior to the pandemic and financial conditions are already very easy. In theory, it makes more sense to target help only towards the people who lost their jobs and to pull back on QE. Why do markets need excess QE in an environment where GDP growth will hit double digits? We will see if there are significant inflationary consequences to this unprecedented action. If there aren’t, the next recession will be met with even more stimulus.
Moar Stimulus!
We are starting to question the size and scope of the stimulus in the face of what will already be a strong period for the economy due to the full reopening. Not only has the federal government just passed a $1.9 trillion stimulus but also it plans to pass an infrastructure bill. The Democrats have a limited window of time, so they are already crafting their next big spending plan. They could easily lose the 2022 mid-term election which would limit their ability to get anything done. Furthermore, they need to show voters that they accomplished something. Therefore, we will probably see an infrastructure plan passed within the next 12 months. It could be massive.
The chart below shows the potential spending breakdown. Biden might unveil a plan that costs $2 to $3 trillion over 8 years. We will review it in detail in the coming months once more information is known about it. This should come in tandem with a tax increase. The impact on corporate earnings will therefore be mixed.
That's a lotta infra pic.twitter.com/Kxrm3PHxfQ
— George Pearkes (@pearkes) March 30, 2021
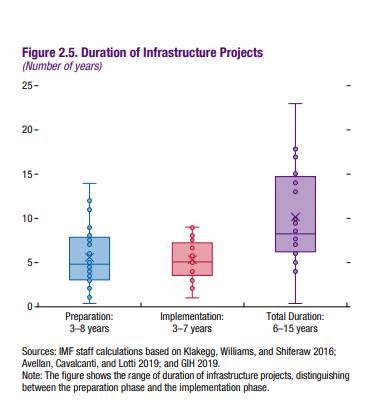
The good news about an infrastructure plan is that even if the Democrats were to pass a plan this summer, the full effect would take place over several years. There aren’t any true shovel-ready jobs. You can’t just snap your fingers and have a $100 million project in place that will create 1,000 jobs. The chart below details this time horizon. As you can see, the planning/preparation phase alone takes 3 to 8 years. Implementation takes another 3 to 7 years. The bad political news for the Dems is much of their plan’s impact won’t be noticeable by the fall of 2022.
Conclusion
The consumer had a very strong March. We are excited to see what awaits in April. Consumer Confidence beat estimates by the most ever. Now it’s time to see how much they spent. retailers should have a great Q1 earnings season. Fiscal and monetary policy expansion combined are the hottest they have ever been. Furthermore, the Dems are planning a massive $3 to $4 trillion infrastructure plan. This spending plan should take place over 8 years. It will be interesting to see the inflationary ramifications of this expansionary policy. So far, the only consequences have been drops in high multiple stocks which policymakers obviously don’t care about. They probably don’t even know what happened in the past few months.
Disclaimer: The content in this article is for general informational and entertainment purposes only and should not be construed as financial advice. You agree that any decision you make will be ...
more

