
Weight Watchers Is A Strong Buy
Weight Watchers International, Inc. (WTW) currently leads our universe.
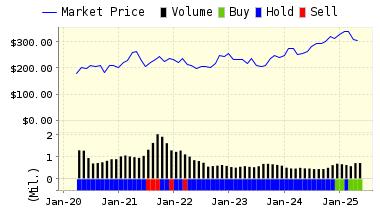
Weight Watchers International, Inc. is the largest provider of weight control programs in the world. The core of their business is weekly meetings, in which they present thier scientifically designed program, incorporating group support and education about healthy eating patterns, behavior modification and physical activity.
Recommendation: We continue with our STRONG BUY recommendation on WEIGHT WATCHERS for 2016-08-02. Based on the information we have gathered and our resulting research, we feel that WEIGHT WATCHERS has the probability to OUTPERFORM average market performance for the next year. The company exhibits ATTRACTIVE Momentum and Price Sales Ratio.
|
ValuEngine Forecast |
||
|
Target |
Expected |
|
|---|---|---|
|
1-Month |
10.86 | 1.59% |
|
3-Month |
10.82 | 1.24% |
|
6-Month |
10.71 | 0.17% |
|
1-Year |
12.74 | 19.14% |
|
2-Year |
8.51 | -20.36% |
|
3-Year |
5.81 | -45.67% |
|
Valuation & Rankings |
|||
|
Valuation |
31.12% undervalued |
Valuation Rank |
|
|
1-M Forecast Return |
1.59% |
1-M Forecast Return Rank |
|
|
12-M Return |
156.97% |
Momentum Rank |
|
|
Sharpe Ratio |
-0.46 |
Sharpe Ratio Rank |
|
|
5-Y Avg Annual Return |
-37.34% |
5-Y Avg Annual Rtn Rank |
|
|
Volatility |
81.74% |
Volatility Rank |
|
|
Expected EPS Growth |
50.35% |
EPS Growth Rank |
|
|
Market Cap (billions) |
0.61 |
Size Rank |
|
|
Trailing P/E Ratio |
15.06 |
Trailing P/E Rank |
|
|
Forward P/E Ratio |
10.01 |
Forward P/E Ratio Rank |
|
|
PEG Ratio |
0.30 |
PEG Ratio Rank |
|
|
Price/Sales |
0.53 |
Price/Sales Rank |
|
|
Market/Book |
n/a |
Market/Book Rank |
|
|
Beta |
2.62 |
Beta Rank |
|
|
Alpha |
1.01 |
Alpha Rank |
|
Market Overview
|
Summary of VE Stock Universe |
|
|
Stocks Undervalued |
56.32% |
|
Stocks Overvalued |
43.68% |
|
Stocks Undervalued by 20% |
23.57% |
|
Stocks Overvalued by 20% |
13.34% |
Sector Overview
|
Sector |
Change |
MTD |
YTD |
Valuation |
Last 12-MReturn |
P/E Ratio |
|
Basic Materials |
2.77% |
-0.60% |
51.29% |
12.85% overvalued |
61.16% |
32.88 |
|
Consumer Staples |
0.57% |
-0.64% |
8.54% |
8.47% overvalued |
7.77% |
24.65 |
|
Utilities |
-1.04% |
-2.16% |
11.40% |
5.52% overvalued |
12.51% |
22.64 |
|
Industrial Products |
0.45% |
-1.19% |
9.60% |
2.37% overvalued |
1.62% |
22.72 |
|
Multi-Sector Conglomerates |
1.17% |
-0.37% |
6.66% |
1.13% overvalued |
5.73% |
18.52 |
|
Aerospace |
-0.38% |
-0.70% |
-3.32% |
0.44% undervalued |
-2.92% |
18.93 |
|
Construction |
1.14% |
-0.95% |
27.87% |
1.87% undervalued |
7.06% |
20.96 |
|
Finance |
0.39% |
-0.68% |
4.58% |
2.83% undervalued |
-0.09% |
16.40 |
|
Computer and Technology |
-0.32% |
-1.07% |
10.39% |
2.85% undervalued |
1.35% |
29.36 |
|
Oils-Energy |
0.92% |
-2.85% |
16.69% |
2.97% undervalued |
-13.95% |
27.43 |
|
Consumer Discretionary |
0.03% |
-0.77% |
6.57% |
3.12% undervalued |
-4.70% |
22.41 |
|
Transportation |
-0.58% |
-1.54% |
8.33% |
5.38% undervalued |
-20.46% |
16.12 |
|
Business Services |
0.06% |
-1.46% |
12.81% |
6.42% undervalued |
-1.07% |
23.73 |
|
Medical |
-0.74% |
-1.07% |
0.11% |
8.35% undervalued |
-19.94% |
27.27 |
|
Retail-Wholesale |
0.45% |
-1.22% |
-0.30% |
10.37% undervalued |
-6.64% |
22.17 |
|
Auto-Tires-Trucks |
-1.04% |
-1.85% |
0.29% |
12.08% undervalued |
-4.35% |
14.62 |
Disclosure: None.
Disclaimer: ValuEngine.com is an independent research provider, producing buy/hold/sell recommendations, ...
more

