
Weekly Technical Scoop Of The Markets
November traditionally marks the start of the best six months of the year for stock markets. At least, that is what the record shows. The Dow Jones Industrials (DJI) has since 1950 had an average gain of 0.6% from May to October vs. an average gain of 7.5% from November to April. The period November to May has had over three times as many up periods as it has had down periods vs. the period from May to October which had only 1.5 times advantage in ups to down.
Of course, the strategy doesn’t work all of the time. Double-digit returns for the May/October period have occurred eight times since 1950. The most recent was the period just completed from May 1, 2017, to October 31, 2017, when the DJI jumped 11.6%. The best one was a 19.2% gain in 1958. In 2009, the May/October period gained 18.9%. But that was following one of the worst ever November/April periods that saw the DJI fall 12.4%. The November/April period has seen only three occurrences where it lost more than 10%. The most recent was the above-mentioned 2008 period where the DJI fell 12.4% while the other two occurred in 1969 and 1973. Interestingly enough, the first November/April period in 1969/1970 saw the Cambodian invasion while the 1973/1974 period was the OPEC oil embargo and the Watergate crisis.
Since we are just coming off a May/October period that saw double-digit returns it is interesting to look at what happened in the ensuing November/April period. As we noted there have been eight occurrences of double-digit returns for the May/October period. We summarize in the table below.
As can be seen from the table there were no occurrences of the DJI falling in the November/April period following double-digit gains in the May/October period. On five occurrences, the gains were also in double digits. On average, the November/April period saw gains of 14.6% following the May/October period that saw average gains of 14.5%. What all of that suggests is the coming six months could see double-digit gains once again for the DJI and the stock market as a whole.
|
Six-Month Switching Strategy DJI% DJI%
Source: www.stocktradersalmanac.com |
The question is, could double-digit gains actually happen in the coming November/April period? The answer is, yes, it could. A lot would have to break positively in the market for it to happen. It would be important for Trump tax cuts to make it through Congress and the Senate. So far, all major legislation has failed especially in the Senate (the most noticeable one was the failure to repeal Obamacare). A proposed corporate tax plan from the Senate diverges from the Trump administration and Congress’s plan. Senators are seeking to delay the tax cuts. In December the debt ceiling comes up again and failure to set a new debt ceiling coupled with the tax plans and the budget could seriously derail the stock markets. It was on the assumption that all of that would get resolved that has helped spur the stock market higher over the past number of months. As well, the tax cut plan could result in $1.5 trillion in debt accumulation over the next decade. That might not sit well with many debt hawks on the Republican side. |
|||||||||||||||||||||||||||
|
Failure to achieve the tax cuts and extend the debt ceiling could set off a stock market panic. It is something to keep a close eye on. This past week also saw some maneuvering in the Mid-East by Saudi Arabia. Not only did Crown Prince Mohammed bin Salman set off alarm bells with the arrest of upwards of 200 individuals accused of corruption totaling US$ 100 billion but Saudi Arabia is believed to be behind the removal of Lebanese Prime Minister Saad Hariri (he actually resigned because he feared for his life). The arrests in Saudi Arabia included royals, media moguls and even a billionaire business tycoon. The whereabouts of Saad Hariri are currently unknown. This was followed up by Saudi Arabia warning its citizens to leave Lebanon. Why? Is there a planned invasion? It is well known the Saudi Arabia along with Israel—both U.S. client states—would like to see the end of Hezbollah in Lebanon. Saudi Arabia also accused Iran of igniting war when a missile was launched from Houthi held Yemen at Saudi Arabia. The Saudis back the Yemen government against Iranian backed Houthi rebels in Yemen. Bombings in Yemen by Saudi Arabia, backed by intelligence from the US, have killed thousands of Yemeni civilians and are creating a potential humanitarian crisis. All this is disturbing as the Trump administration is egging on the Saudis and along with Israel, they would like to see an end to Hezbollah and Iran and the breakup of what they refer to as the Shia or Shiite Crescent. But a new front in the ongoing wars in the Mid-East may not sit well with global stock markets. Oil prices could soar and the proximity of Russian troops in Syria along with powerful Russian and Chinese interests in Iran and elsewhere could result in clashes that no one wants, igniting a much broader war. The stakes are quite high. An excellent analysis of the situation is in the Saturday, November 11, 2017 issue of The Globe and Mail: The new Saudi Crown Prince, the Iranian threat – and the drumbeats of war. A potential clash over tax cuts and the debt ceiling and the potential threat of the expansion of war in the Mid-East could be two deadly companions that could rattle markets. |
||||||||||||||||||||||||||||
Bitcoin Watch!
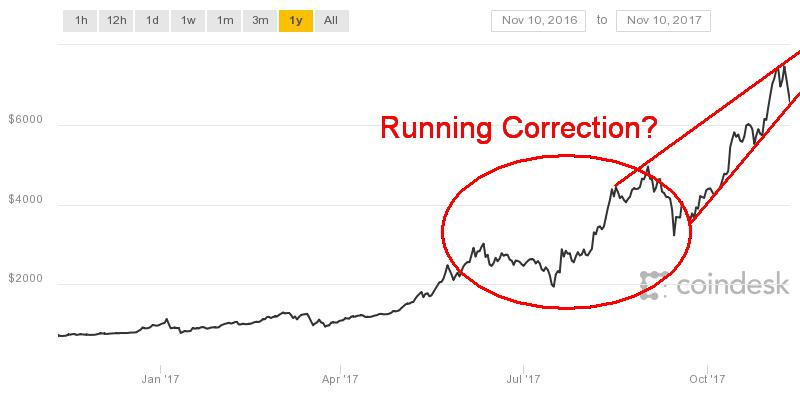
Source: www.coindesk.com
In a space of 48 hours, Bitcoin fell roughly $1,300. It is not as if that was the first time as earlier when Bitcoin first approached $5,000 it also fell suddenly and sharply. Still, it is a reminder of the volatility that appears to be inherent in Bitcoin and cryptocurrencies. They are not for the faint of heart. This came after Bitcoin hit just shy of $8,000 (high was $7,879) after it was announced plans to split the Bitcoin into two were suspended. Then came the news that Bitcoin gold was to go live this weekend. What it is, is a fork of the Bitcoin Blockchain. Current holders of Bitcoin were to be “airdropped” (the term used) the new coins. The move has been heavily criticized. When Bitcoin cash was launched in August it quickly took off. Could the announcement of Bitcoin gold have had the opposite effect?
All of this has come against a backdrop of learning that “Buy Bitcoin” is googled more than “Buy gold.” After all, gold and Bitcoin share some of the same characteristics. Both are praised by those who believe that fiat currencies will eventually fail and that one needs to diversify out of them to protect oneself against the inevitable decline of paper currencies.
Let’s remember gold has been around as money for 3,000 years, whereas Bitcoin is relatively new, arriving on the scene only a few years ago. Yes, Bitcoin is up over 550% this year even after this week’s fall whereas gold is only up 12%. But gold is far more durable and can’t be hacked on a computer like Bitcoin and other cryptocurrencies can. Bitcoin has easier portability but gold’s supplies are limited; the number of cryptocurrencies could become endless and the ability to create more unlimited. That is not much different from fiat currencies. Bitcoin is quite volatile as the last couple of days attests whereas gold is quite staid by comparison. Gold is a real asset whereas Bitcoin is an electronic asset. And what if the grid went down?
With the proliferation of Initial Coin Offerings (ICOs), we are learning that companies, including some small gold companies, are converting themselves into cryptocurrency companies to get in on the fast action in the cryptocurrency sphere. Investment dealers are also leaping into the arena. It reminds us how in the late 1990s and early 2000s companies including many small gold mining companies were switching from gold mining to high tech/dot.com to take advantage of the mania in the sector. We know that eventually the bubble bursts as many high tech/dot.com companies went bust in the inevitable collapse. Many believe that Bitcoin and cryptocurrencies are just the latest mania in a bubble waiting to burst.
Gold mining companies face innumerable challenges, especially those operating in foreign countries. Bitcoin and the cryptocurrencies have yet to really face the regulators. Yet the Government of Canada, the Bank of Canada, FINTRAC, and the securities regulators like the OSC are all looking into the cryptocurrency world. They are concerned about tax evasion, money laundering and a host of other issues. In the U.S. the SEC, the CFTC, and the Fed are also looking at cryptocurrencies including Bitcoin. It is a matter of when not if the regulators come down on the phenomenon. Ian McGugan of The Globe and Mail recently noted these and other issues in his recent column Inside the Market on November 10, 2017.
Bitcoin appears to have fallen swiftly to trendline support currently near $6,500. A breakdown under $6,500 and especially under $6,000 could set off a panic. Bitcoin could also be in the process of forming an ascending wedge triangle. That suggests that Bitcoin could recover from these levels, moving higher once again, and even exceed $8,000. But if the ascending wedge triangle is correct it eventually busts to the downside.
MARKETS AND TRENDS
|
Percentage Gains Trends |
|||||||||||
|
Stock Market Indices |
Close Dec 31/16 |
Close Nov 10/17 |
Week |
YTD |
Daily (Short Term) |
Weekly (Intermediate) |
Monthly (Long Term) |
||||
|
S&P 500 |
2,238.83 |
2,582.30 (new highs) |
(0.2) |
15.3 |
up |
up |
up (topping) |
||||
|
Dow Jones Industrials |
19,762.60 |
23,422.21 (new highs) |
(0.5) |
18.5 |
up |
up |
up (topping) |
||||
|
Dow Jones Transports |
9,043.90 |
9,501.36 |
(2.6) |
5.1 |
up |
up |
up (topping) |
||||
|
NASDAQ |
5,383.12 |
6,750.94 (new highs) |
(0.2) |
25.4 |
up |
up |
up (topping) |
||||
|
S&P/TSX Composite |
15,287.59 |
16,039.26 (new highs) |
0.1 |
4.9 |
up |
up |
up |
||||
|
S&P/TSX Venture (CDNX) |
762.37 |
796.48 |
0.6 |
4.5 |
up |
neutral |
up |
||||
|
Russell 2000 |
1,357.14 |
1,475.27 |
(1.3) |
8.7 |
up |
up |
up (topping) |
||||
|
MSCI World Index |
1,690.93 |
1,996.03 (new highs) |
(0.3) |
18.0 |
up |
up |
up |
||||
|
Gold Mining Stock Indices |
|||||||||||
|
Gold Bugs Index (HUI) |
182.31 |
187.04 |
0.5 |
2.6 |
down |
down |
neutral |
||||
|
TSX Gold Index (TGD) |
194.35 |
192.52 |
0.2 |
(0.9) |
down |
down |
neutral |
||||
|
Fixed Income Yields |
|||||||||||
|
U.S. 10-Year Treasury yield |
2.45 |
2.40 |
2.6 |
(2.0) |
|||||||
|
Cdn. 10-Year Bond yield |
1.72 |
1.93 |
(1.5) |
12.2 |
|||||||
|
Currencies |
|||||||||||
|
US$ Index |
102.28 |
94.28 |
(0.6) |
(7.8) |
up |
up (weak) |
up (weak) |
||||
|
Canadian $ |
0.7440 |
0.7890 |
0.6 |
6.1 |
down |
up (weak) |
neutral |
||||
|
Euro |
105.22 |
116.66 |
0.5 |
10.9 |
down |
up |
up (weak) |
||||
|
British Pound |
123.21 |
131.90 |
0.9 |
7.1 |
down (weak) |
up |
down |
||||
|
Japanese Yen |
85.57 |
88.10 |
0.5 |
3.0 |
down |
down |
neutral |
||||
|
Precious Metals |
|||||||||||
|
Gold |
1,151.70 |
1,274.20 |
0.4 |
10.6 |
down |
up (weak) |
up |
||||
|
Silver |
15.99 |
16.87 |
0.2 |
5.5 |
down (weak) |
neutral |
neutral |
||||
|
Platinum |
905.70 |
932.10 |
1.1 |
2.9 |
up (weak) |
down |
down |
||||
|
Base Metals |
|||||||||||
|
Palladium |
683.25 |
993.10 |
0.2 |
45.4 |
up |
up |
up |
||||
|
Copper |
2.5055 |
3.08 |
(1.3) |
22.9 |
up |
up |
up |
||||
|
Energy |
|||||||||||
|
WTI Oil |
53.72 |
56.74 (new highs) |
2.0 |
5.6 |
up |
up |
up (weak) |
||||
|
Natural Gas |
3.72 |
3.21 |
7.8 |
(13.6) |
up |
up |
up (weak) |
||||
Source: www.stockcharts.com, David Chapman
Note: For an explanation of the trends, see the glossary at the end of this article.
New highs/lows refer to new 52-week highs/lows.
Source: www.stockcharts.com
The supercharged market just keeps on trending upward. However, it may have hit a bump in the road this past week. Stock markets once again made new all-time highs, but in a reversal closed mildly lower on the week. The reversal was sparked largely by concerns over the ability of the Trump administration to pass its tax reform and the upcoming debt ceiling. Making new all-time highs once again were the Dow Jones Industrials (DJI), the S&P 500, and the NASDAQ. The Dow Jones Transportations (DJT) did not once again make new all-time highs, but more on that later.
Joining the party were the Dow Jones Utilities (DJU), the NASDAQ 100, the Russell 1000 and 3,000, the S&P 100 (OEX), the S&P 400 (Midcap), and the Wilshire 5,000. The U.S. indices not making new all-time highs were primarily the smaller cap indices such as the broad NYSE, the AMEX, the Dow Jones Composite (DJC), the Russell 2000, and the S&P 600 (Smallcap). We won’t note all international markets, but the Shanghai Stock Exchange (SSEC), the German DAX, the Tokyo Nikkei Dow (TKN), and the London FTSE all made new all-time highs too. Following those highs, the DAX and the FTSE closed the week sharply lower. Canada’s TSX Composite also made new all-time highs but managed to hold on to a small 0.1% gain.
Since the downside reversal this past week was not overly dramatic we are not putting huge stead in it that it will turn out to be meaningful. By meaningful, we believe another short-term correction is coming but we most likely have not seen the final high. As we note in our opening essay, following this correction we should regroup and move once again to new all-time highs. We are entering the best six months of the year and, as we noted earlier, we have no reason to believe at this point we won’t have another strong upward thrust.
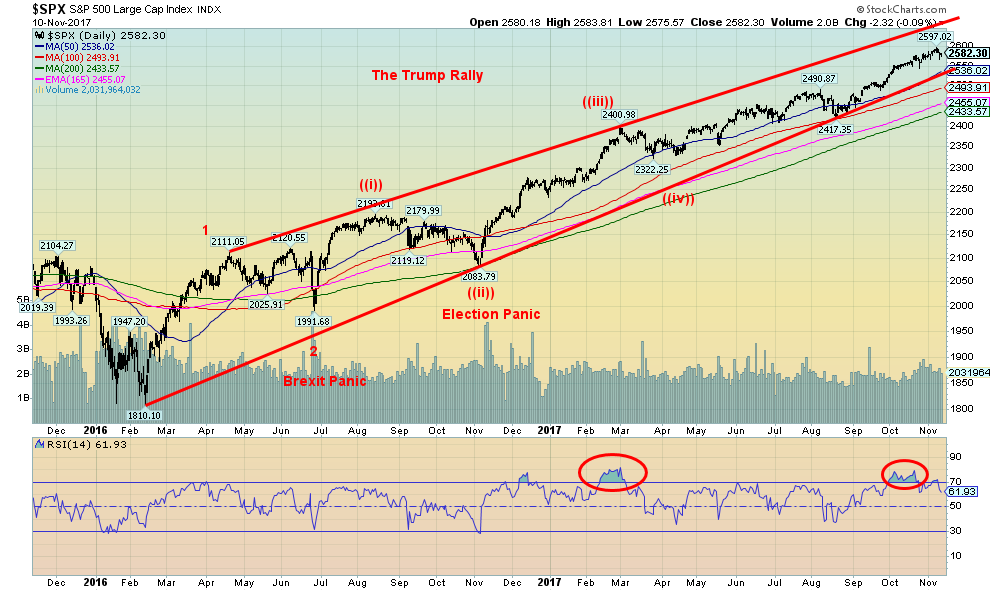
The question is, how deep will this correction be? We would not be signaling a more severe correction unless we broke back under 2,400. That would break the last most significant daily low. Even a drop down towards 2,400 would signal a correction on the order of 5–7%. Since the election last year the S&P 500 is up a stellar 24%. Only two shallow corrections have been seen since, one of 3.3% and another one of about 3%.
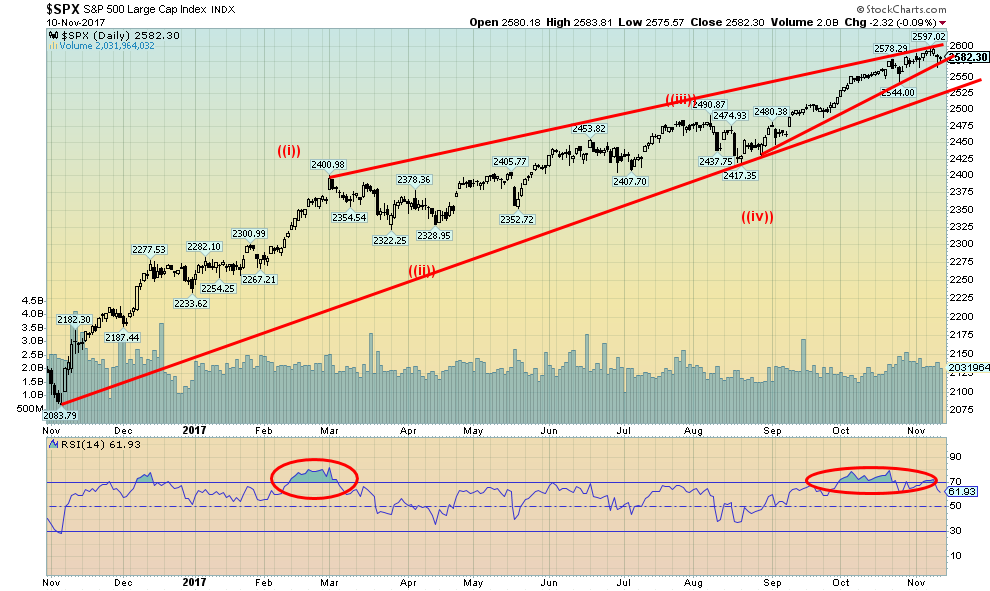
The past few weeks have seen the RSI indicator almost consistently over 70. While that in itself is not a signal of a top it is a sign that the market could be topping and that a correction might be imminent. The correction, long overdue, may now be underway.
Source: www.stockcharts.com
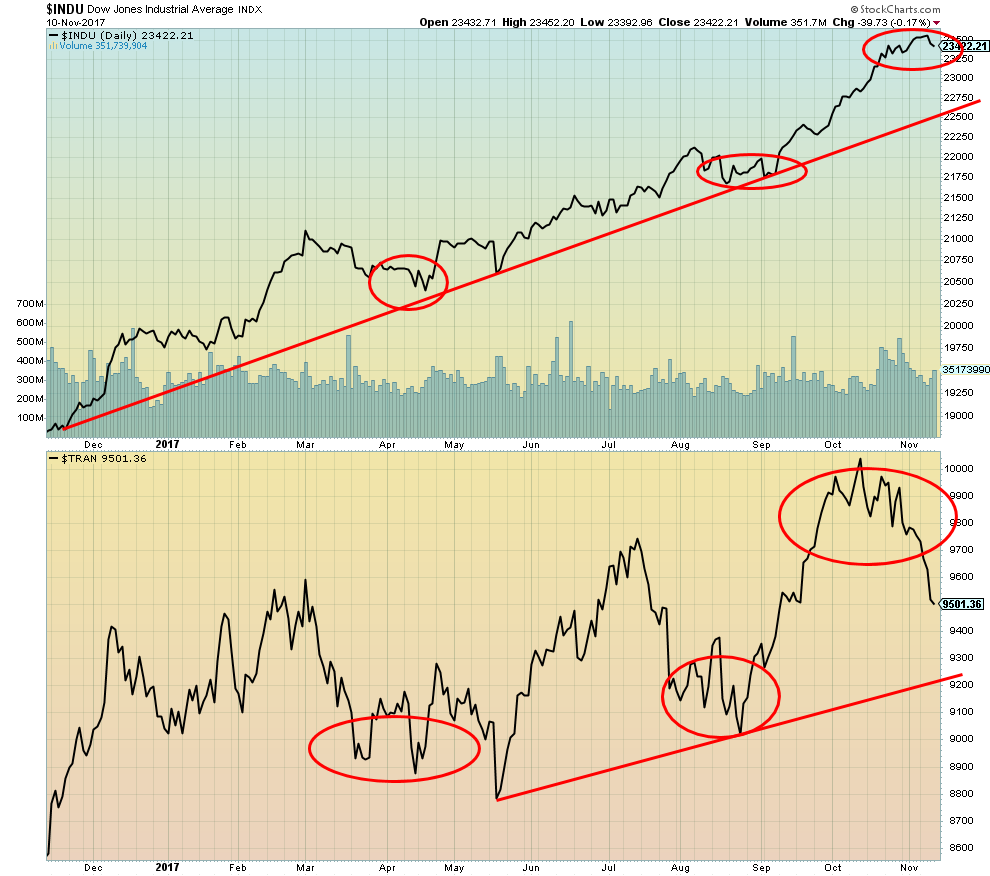
Another sign of an impending top is the divergence between the DJI and the DJT. While the DJI made new all-time highs again this past week the DJT not only did not. It was nowhere near its previous high. The DJI reversed and closed lower by 0.5%. The DJT plummeted 2.6%. Dow Theory states that the averages must confirm each other. This divergence between the industrials and the transportations has persisted for the past few weeks. For the DJI a drop below Thursday’s low of 23,310 could swiftly drop the DJI to 23,000. But, as with the S&P 500, the real trouble for the DJI does not get underway until we drop under 21,600. The DJT would be in trouble with a decline under 9,200.
The big question on everyone’s mind is: is this the final top or is this another correction before we make yet another run to new all-time highs. In reading Elliott Wave International (EWI) they appear to believe we may be making our final high. That is entirely possible. However, as we noted in our essay, history would suggest that despite the double-digit gains during the so-called weak stock market period May to October, double-digit gains could once again be in store for the coming November to April period.
Source: www.stockcharts.com
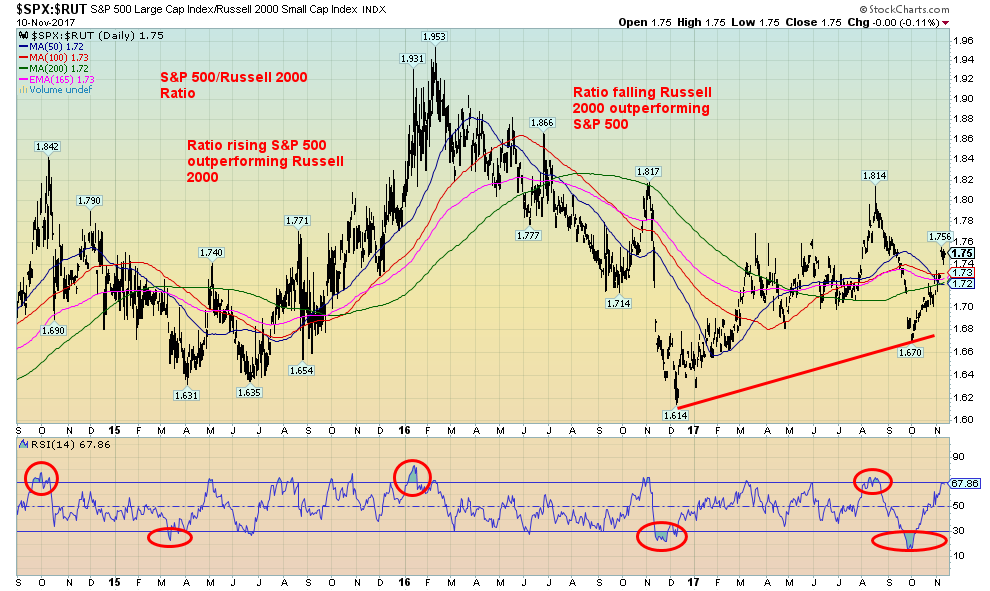
Here is a good sign that the markets have shifted in favor of the large-cap stocks. The S&P 500/Russell 2000 ratio is one we have shown in the past. The past few weeks have seen the ratio jump in favor of the S&P 500 over the Russell 2000. That is not unusual in bear moves where the large-cap stocks tend to outperform the small-cap stocks. In bull markets, the reverse is normally true. Small cap stocks outperform large-cap stocks.
Source: www.stockcharts.com
Here is a closer look at the S&P 500 dating from the election a year ago November. It has been quite a run and as we noted the market is up about 24% in that period. The S&P 500 is up 42.6% from the lows of February 2016. We believe that marked the end of Intermediate Wave 4 up from the major low of March 2009. We have little doubt we are currently in Intermediate Wave 5. The question is: when does it end? The 200-day MA is currently at 2,433. We noted a drop below 2,400 could signal the beginning of a more severe bear market and begin to confirm a final high. Any pullback now that does not breach those levels would merely be another correction within the context of Intermediate Wave 5’s advance. Support for the S&P 500 can be seen down to around 2,525. The advance stays alive if we can hold that line. New highs above 2,597 would indicate that the current advance is not over.
Source: www.stockcharts.com
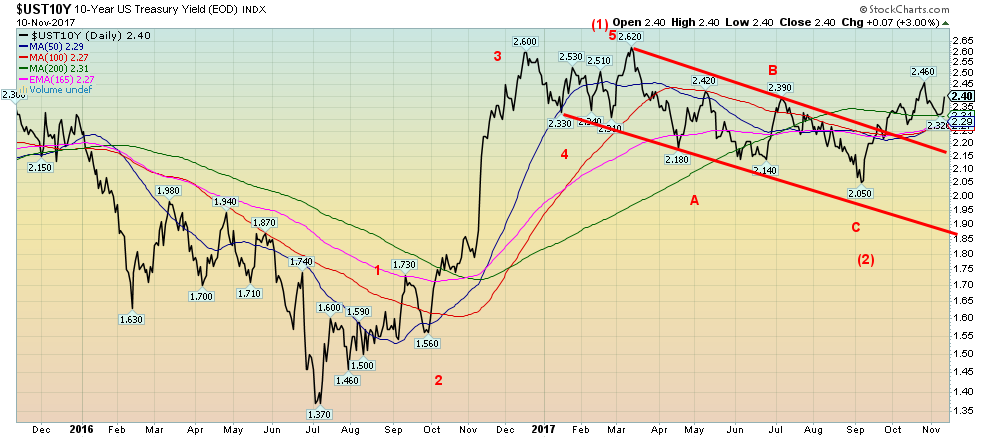
U.S. Treasury bonds appear to be concerned about the potential failure of tax reform plus increased deficits and the potential for the debt ceiling debate to turn rancourous. The yield on the 10-year U.S. Treasury note rose to 2.40% this past week from 2.34% the previous week. A break above the previous high of 2.46% would signal that the next move higher is underway. We still believe we could see at least 3% before this current move is over. Only a break now back below 2.30% could suggest that there is still some more downside work to be completed before the advance gets underway. But concerns over the tax plans and the debt ceiling would do it. The bond market could also be concerned about rising oil prices and the growing tension in the Mid-East between Saudi Arabia and Iran. Any outbreak of war there could send oil prices soaring. That, in turn, could send bond yields higher. Oddly enough bond yields in Canada as measured by the 10-year Government of Canada bond (CGB) moved lower this past week to 1.93% from 1.96%. The 10-year U.S.- Canada spread as a result widened to 49 bp from 38 bp.
Source: www.stockcharts.com
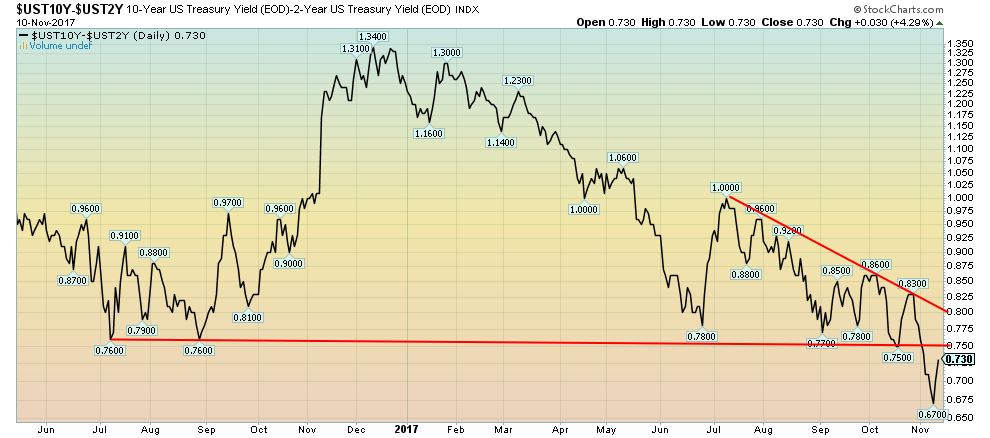
Spread watch. The 2–10 year spread bounced back this week to 0.73% from 0.71%. But that was not before the spread fell as low as 0.67%. We could test the 0.75% breakdown point or even go as high as 0.80% and the downtrend line but we doubt it would go much further. Signs still seem to indicate the Fed will hike rates in December. We continue to expect the 2–10 spread to narrow over time. A very low spread and especially a negative spread have preceded recessions in the past.
Source: www.stockcharts.com
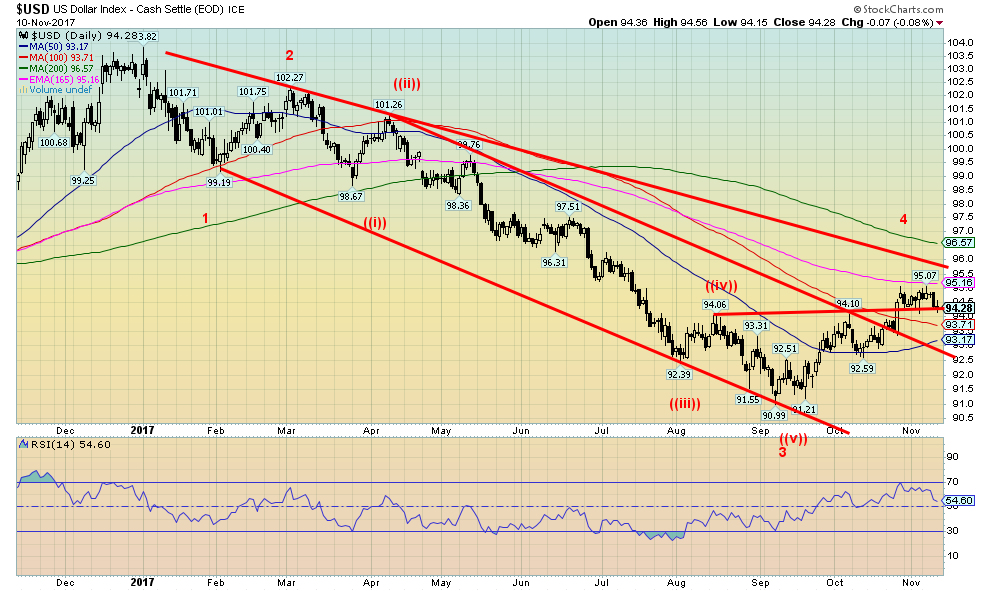
The U.S.$ Index stalled out on its rally this past week. Most likely it was the result of very little to drive it. There were no economic releases of any major importance. Consumer confidence as measured by the Michigan sentiment index slipped from 100.7 to 97.8. It’s still high but not quite as a lofty. The tax reform differences between the House and the Senate most likely caused the U.S.$ stall out and the goings on in the Mid-East might also have helped stall the U.S.$’s advance.
It is possible that the U.S.$ Index made a small head and shoulder’s bottom recently during the August to October period. Potential targets on the H&S bottom are around 97.25-97.50. That would imply a breakout over the downtrend line from the January 2017 top of 103.82. Trouble is once it broke out the U.S.$ Index has gone nowhere. If anything the U.S.$ Index is threatening to break lower once again. It may be temporary and new highs over 95.07 could soon send us to 95.50 resistance. But any breakdown that takes us back under the possible right shoulder low of 92.59 could end any thoughts of a run to 97. Considerable support can be seen down to 93.
Source: www.stockcharts.com
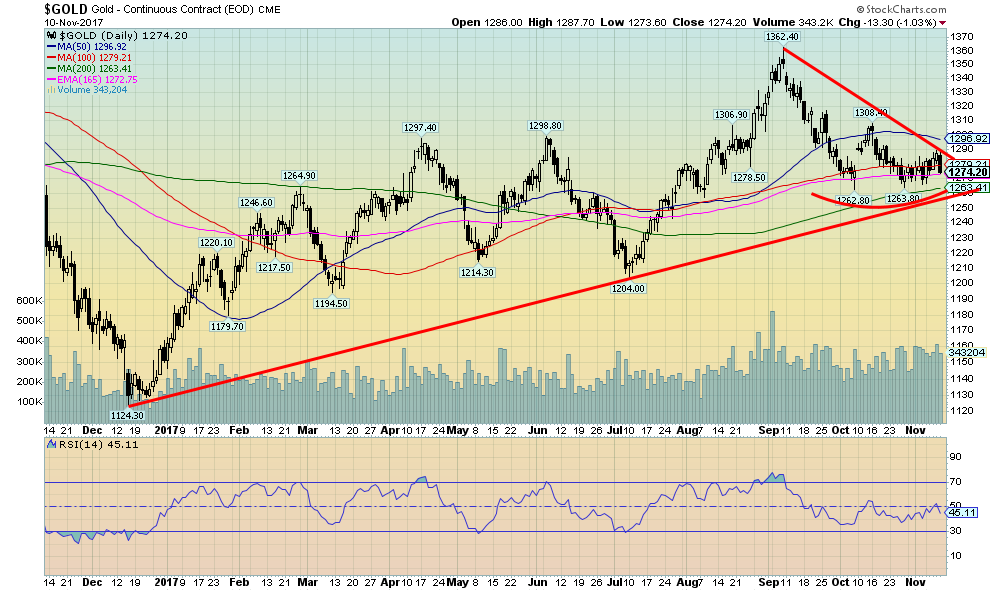
Gold continues to spin wheels although we did manage a small up week gaining 0.4%. Silver gained 0.2%, platinum was up 1.1% while palladium gained about 0.2%. Gains for gold would have been higher except for the sudden flash sale on Friday of 4 million ounces that plunged the gold price down about $9. More on that below.
The World Gold Council www.gold.org published its “Gold Demand Trends Q3 2017” and one could term it a bit of a disappointment. Highlights were 9% drop in year over year demand to 915 tonnes while year to date demand is down 12%. While ETF’s had positive inflows it had to be disappointing at 18.9 tonnes vs. a huge 144.3 tonnes in Q3 2016. Jewellery also slipped by 3% but central bank buying continued to be strong with a 25% gain to 111 tonnes. Investment buying (bars and coins) also was up 17% to 222.3 tonnes but is soft compared to some other periods. At the other end supply was down by 2% as mine production continued to decline down 1%. Recycling activity was also down. Mine production has been sliding slowly for months. And the world is not exactly finding new sources. Gold remains rare. It can take a miner upwards of 15 years to go into production depending on resources assuming the miner finds a mineable resource.
If gold can hold above recent lows of $1,262.80 and $1,263.80 it is possible that gold is making a double bottom. A firm breakout could be seen over $1,300 and project up to the $1,340 to $1,350 zone. A break below $1,262.80, on the other hand, could see gold fall swiftly towards $1,250. Uptrend line support does come in at around $1,260 so that could hold. Our expectations are that gold should make a low somewhere in the November/December period. Seasonals usually turn quite positive past December until February/March.
Note: The CFTC has not released this past week’s Commitment of Traders Report as at the time of our report. Therefore, we cannot comment on the latest commercial COT.
Source: www.kitco.com, www.goldchartsrus.com
The games continue it seems. Someone unloaded almost 40,000 contracts of gold on Friday at around 11:10 AM. Each contract represents 100 ounces of gold. It jolted the market triggering a mini-selloff as gold plunged over 1%. A wake-up reminder of the goings on in April 2013 when gold plunged $200 in a day. There was no news, no headlines, nothing that would make gold plunge suddenly. It is not the first time this year either. And sometimes it works the opposite way. A 2-million ounce trade last month on the buy side sent prices higher. Nonetheless, the volatility was unusual. The explanations from the gold groups such as GATA www.gata.org were once again central bank manipulation. GATA even left a phone number for the Bank for International Settlements (BIS) in Basel, Switzerland +41-61-280-8080 and ask for their gold swaps and leases department. The BIS is known as the central bank of the central banks. Still, damage was minimal all things considered and if there is no follow-through next week then gold could resume its recent attempts to rise.
Source: www.stockcharts.com
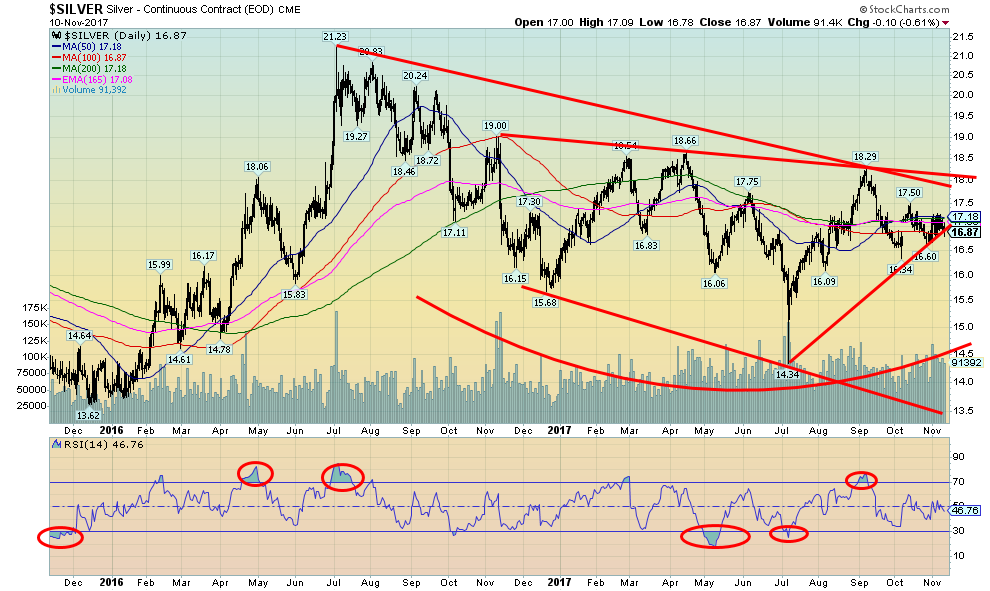
Silver prices continue to cling to an uptrend line from the July 2017 low of $14.34. We continue to believe that was the low for the move. We noted that while silver made new lows in July gold did not. Similarly on the return rally that topped in September gold made new highs but silver did not. Naturally silver needs to continue to hold the uptrend line—otherwise, a drop towards $16 could quickly get underway. Silver needs to regain above $17.50 to suggest a test of $18. There may be a larger pattern here that once silver breaks out over $18 a run to potential targets at $22.50 to $22.75 is possible. That would imply new highs above the July 2016 high of $21.23. Silver is neutral here. The pattern forming continues to appear bullish but realistically we need a breakout above $18 to confirm that. Otherwise, any downside should be constrained by $16. We would be surprised to see prices lower. The gold/silver ratio at 75.53 remains highly favorable towards silver over gold. Indeed, over the past five years we have rarely seen the gold/silver ratio remain so high for so long. The last comparable period was 1990–1998. Eventually, it did end and as precious metals prices rose silver led the way.
Source: www.stockcharts.com
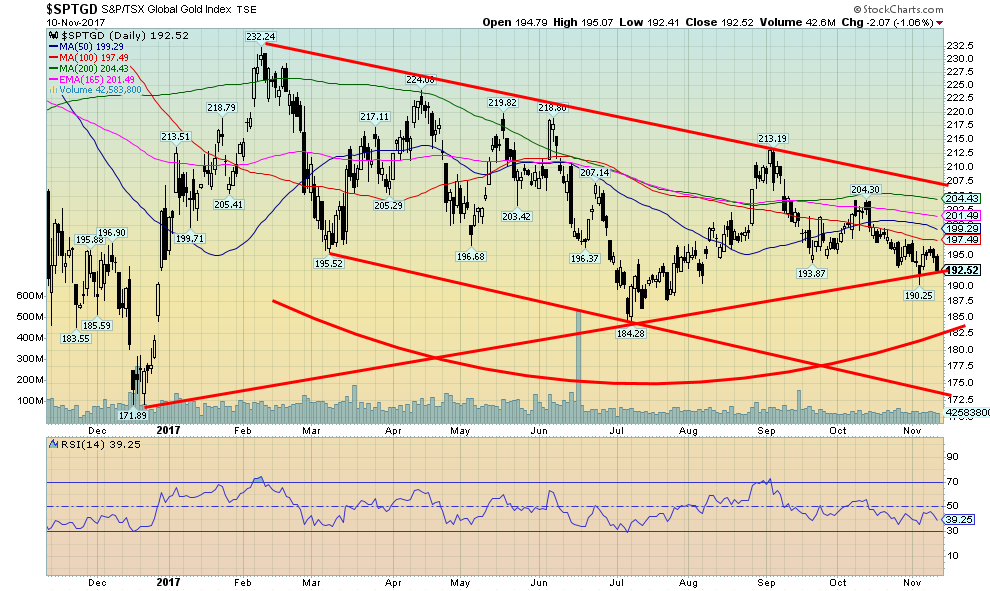
Gold stocks as measured here by the TSX Gold Index (TGD ) remain frustrating. Currently, the TGD is barely clinging to an uptrend line from the December 2016 low. A firm breakdown under 190 could suggest a swift decline to major support in the 172/175 zone. O the other hand a breakout over 208 could suggest a considerable move to 250/260. The Gold Bugs Index (HUI) also remains caught in a sideways pattern. For the HUI the breakout point is seen at 220 and the breakdown point at 180. The Gold/HUI ratio remains high at 6.8. Back in 2011 at the market top, the Gold/HUI ratio was just below 2.4. The TGD’s pattern might also suggest that there is more work to be done in complete what we believe is a bottom pattern. Also with an RSI at 39 there might be more downside to drag the indicator below 30 and a friendlier buying zone. We do not like the current downward drift but we are encouraged with what appears as bottom forming pattern that appears to be forming in 2017.
Source: www.stockcharts.com
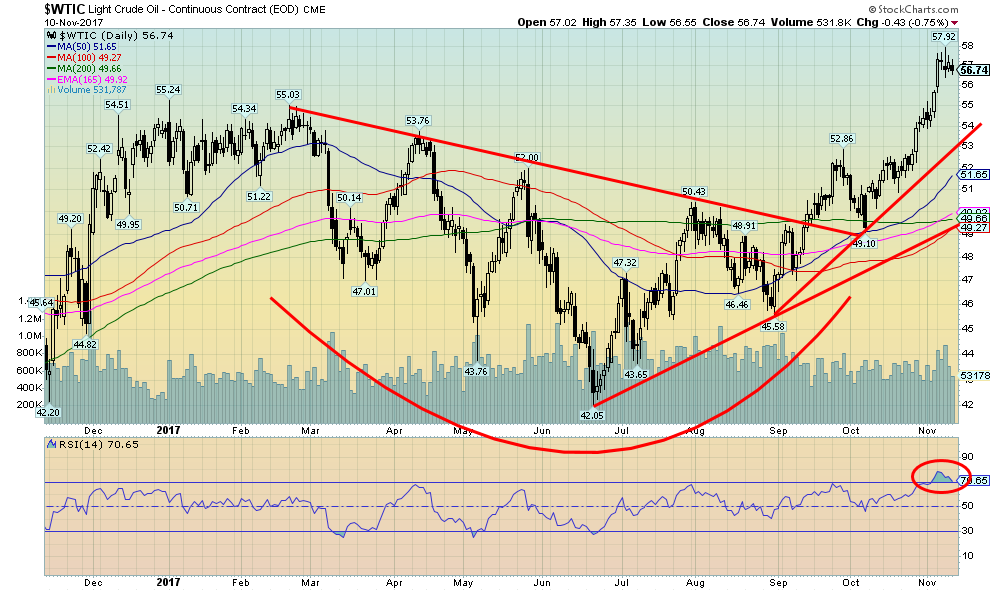
With tensions growing in the Mid-East WTI oil prices appear poised to move higher. WTI oil hit $57 this past week while Brent crude closed at $63.60, the highest level since 2015. Brent crude appears to have broken out of a consolidation pattern and could be targeting $75. WTI Oil could be targeting up to $70. Apparently, there was significant buying of out of the money call options this past week for Brent at the $70 and $80 level. Tensions in the Mid-East between Saudi Arabia and Iran are driving oil prices. If real war broke out between the two, $80 may be just a pause point. Saudi Arabia and Iran are number 2 and 7 respectively of the world’s top oil producers with almost 17 million barrels per day. Curiously enough, if the U.S. produced no oil it would still not cover the U.S’s daily demand of 19.5 million barrels daily. China at 12 million barrels daily has to import a large amount of its oil primarily from Saudi Arabia and Iran. The U.S. still gets roughly 1.1 million barrels a day from Saudi Arabia. Officially, at least, the U.S. doesn’t get any oil from Iran. Still, any outbreak of war in the Mid-East could have considerable negative impact on oil prices. The Iranians might even try to block the Straits of Hormuz through which almost 17 million barrels a day passes. Any outbreak of war between the two powers could also trigger potential clashes between the great powers Russia and the US and even China. The chart looks positive and we expect to see higher oil prices going forward.
Disclosure: None.


