
Weekly Market Outlook - So Bad It's Good? Maybe. Or...
We mentioned a week ago that the selling effort had taken on a self-sustaining life of its own. The more the bears sold, the scarier things got, causing more people to sell, inciting more exits... you get the idea.
That reality continued to gel last week, although it had more help than most anyone is talking about. Friday was a big day for the markets not just because it was an option-expiration day, and not just because it was a triple-witching day. It was the last quadruple-witching day of the year, forcing lots of 'now or never' scenarios for traders.
One can't help but wonder if, now that any options-related overhang has been lifted, the underpinnings for the selloff have vanished. A bunch of other clues suggest a bottom has just been made.
We'll explore the possibility in some more detail below, after a review of last week's economic reports and a preview of this week's.
Economic Data Analysis
Pretty busy week last week in terms of economic news, but outside of the Federal Reserve's decision to raise interest rates in December but back off on 2019's plans to push them higher, nobody was able to look past the market's meltdown. Let's go back and look at the numbers you missed, in order of appearance.
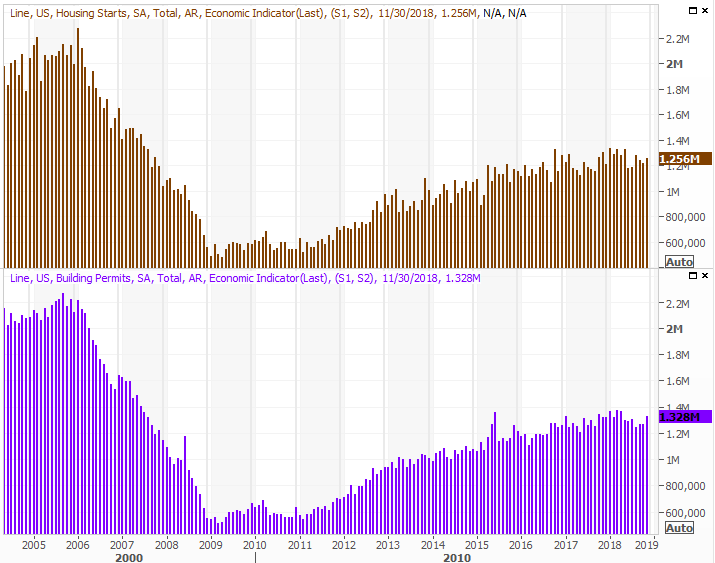
The real estate market may not be in the dire straits some were thinking it might be in. November's housing starts and building permits were not only better than expected, they were better than October's totals.
Housing Starts and Building Permits Charts
Source: Thomson Reuters
One good month isn't a trend, but it's an encouraging start...
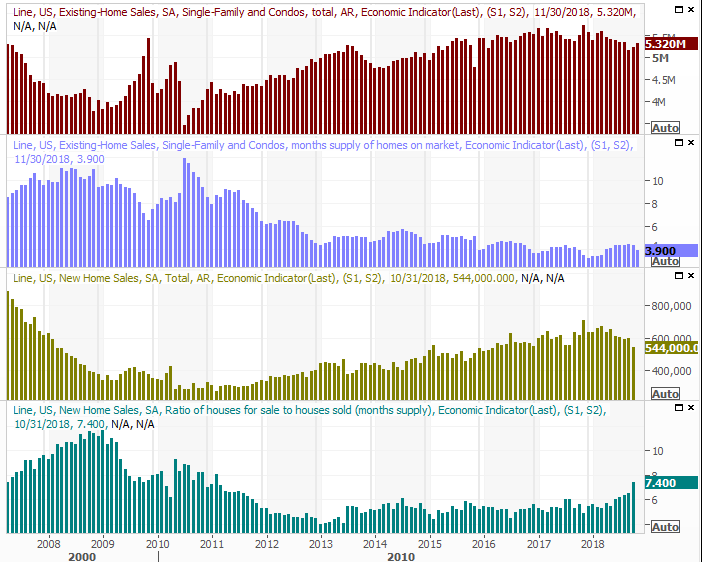
... a start bolstered by an uptick in existing home sales last month. Likewise, one good month doesn't undo a few months of weakness, but it's a start. Also notice that inventory of existing homes for sale has been dialed back a little.
New and Existing Home Sales Charts
Source: Thomson Reuters
We won't get new home sales data until this week, but the pros are looking for some forward progress on that front too. Given the other real estate data now in-hand, it's not difficult to expect we'll at least see that target met.
Last but not least, though not a surprise, the third and final estimate of Q3's GDP growth rate was 3.4%, down just a bit from the prior guess of 3.5%. It's still strong, though it remains to be seen if that's enough to keep the economy going at full speed.
GDP Growth Charts
(insert 121618-gdp)
Source: Thomson Reuters
Everything else is on the grid.
Economic Calendar
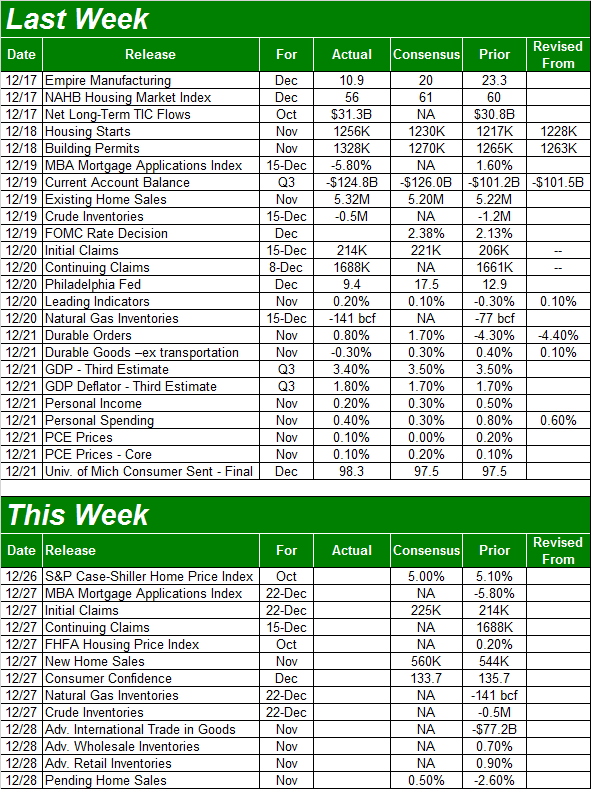
Source: Briefing.com
This week won't be as busy, which is fine given the holiday shutdown. Aside from the look at last month's new home sales, on Wednesday we'll get S&P Case-Shiller Home Price Index report, then on Thursday we'll hear the FHFA's Housing Price Index. Both have continued to trend higher, but the pace of that progress is slowing down. Given the recent purchase activity though, it wouldn't be a total shock to see prices accelerate for October. [Both data points are two months behind.]
Home Price Index Charts
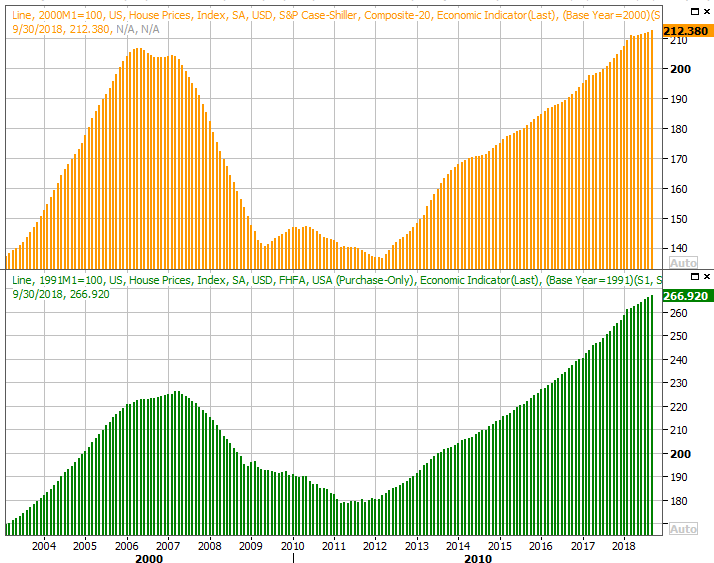
Source: Thomson Reuters
The only other item of interest on the docket for this week as December's consumer confidence report from the Conference Board. Economists are looking for a slight lull, though even a modest dip would leave the measure near multi-year highs. The Michigan Sentiment Survey, however, has conspicuously leveled off.
Consumer Sentiment Charts

Source: Thomson Reuters
Stock Market Index Analysis
Brutal. That's the only way to describe Friday's action after four equally-rough days earlier in the week. Friday's close of 2416.62 for the S&P 500 was 2.08% lower than Thursday's, translating into a 7.0% loss for the week (and off 17.8% from September's record high). That was the worst week in a decade, fact. The most recent instance of more full-week pain was October of 2008.
That ill-fated week in October wasn't the market bottom following the subprime mortgage meltdown, by the way, but by that point the bulk of the losses were already on the books. The S&P 500 only drifted lower from there, reaching a pivot in March of 2009. One can't help but wonder if last week was a similar "can't get any worse" kind of event.
There's certainly a couple of hints that suggest something was unusual, almost artificial about last week's meltdown that could created the capitulation we've been looking for. One of them is the fact that almost all index funds rebalanced on Friday. Also, Friday was a quadruple-witching day, where owners of futures and options had to make a decision. Given the multi-year high in put-trading activity, they were clearly active, exacerbating the already-bearish trend. It was so bad, in fact, that it may well have flushed out. We explored (and charted) the premise at the website on Friday.
We have to entertain the high likelihood that at least a short-term bottom has been made, but first, let's assume the current momentum was built to last.
Let's also start this week's chart analysis with a look at the weekly version of the S&P 500, just to put all of this in perspective. It's strangely ugly, with the sellers blowing past any potential technical floor. Curiously, the VIX didn't pop like it has with other major bottoms even though the selloff was the most dramatic plunge in years. Note the volume surge too, which often signals capitulations. But, in that the VIX hasn't screamed higher and there's no other floor in sight (including no Fibonacci retracement line), it's certainly possible there's more downside to go.
S&P 500 Weekly Chart, with Volume
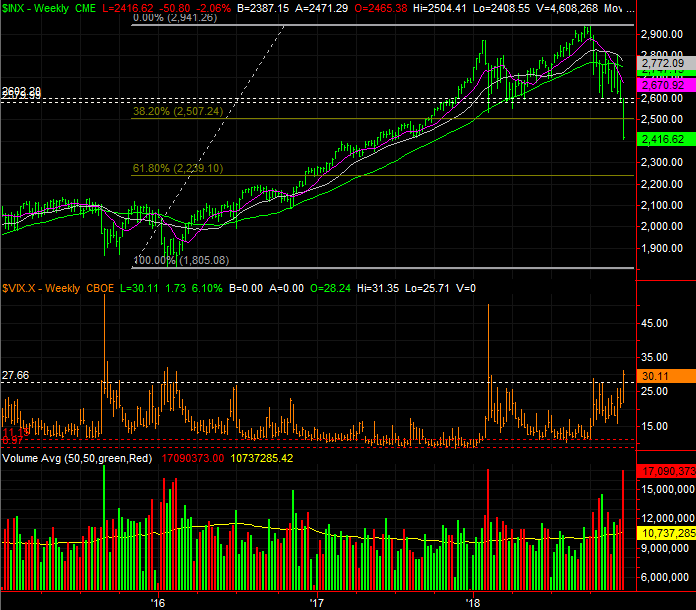
Source: TradeStation
The weekly chart of the NASDAQ Composite tells the same story.
NASDAQ Composite Weekly Chart, with Volume
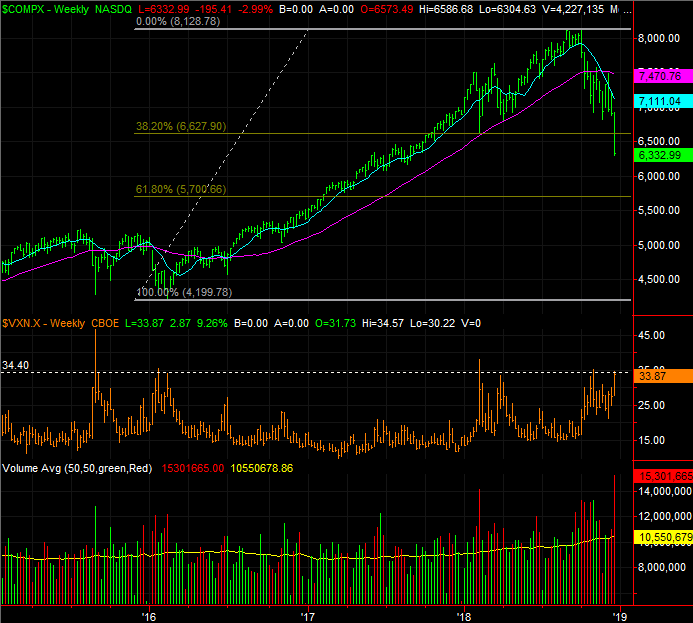
Source: TradeStation
Zooming into the daily chart doesn't tell us much more, but it does better illustrate just how uncanny last week was. It also suggests, given the sizeable though not red-hot advance from the VIX, that the stage may be set for a dead-cat bounce. The catch? Investors can't jump to the conclusion that last week's drubbing absolutely has to be the shape of things to come. The biggest risk here is true fear of a bear market, which ironically enough, will create a bear market.
S&P 500 Daily Chart, with Volume
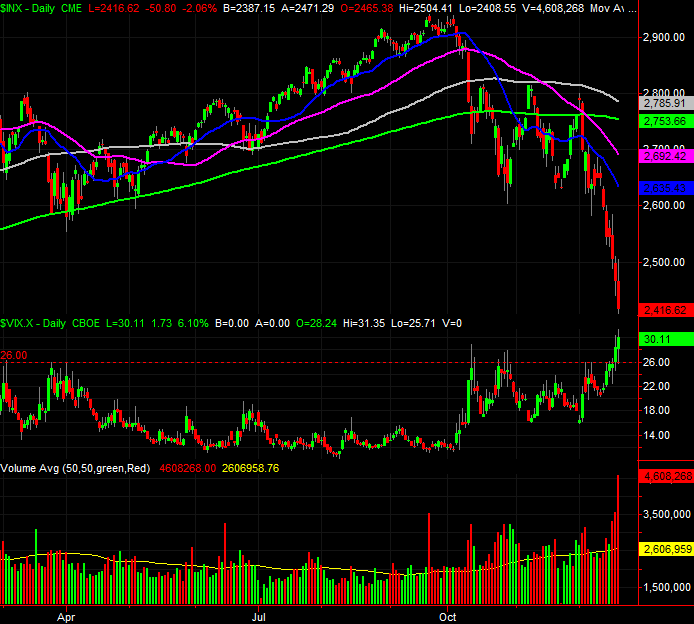
Source: TradeStation
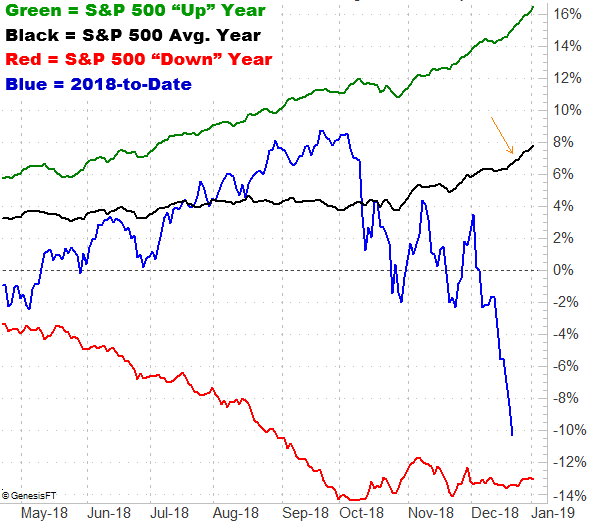
One more data nugget: The Santa Claus rally? It usually takes shape between the Christmas and the New Year (although the week before Christmas doesn't have a bad track record). It's just another tendency working in favor of a bounce from here, bolstering the odds of a dead-cat bounce. Of course, the graphic below is also something of a jaw-dropper. This year was going fine, until December started. Then, a wipe-out.
S&P 500 YTD Performance vs. Average Day-to-Day
Source: TradeNavigator
To that end, be wary of a sharp reversal. Though we're due for some relief, it doesn't necessarily have to last long. Any recovery effort has to crawl back above all the key moving averages to repair the damage done over the course of the past two weeks. For the S&P 500, that means a move all the way back above the 100-day moving average line at 2785.9. That's a 15.3% rebound for the index, and there's little room for error between here and there. One misstep could easily put the market back in a downtrend.
We're truly in uncharted waters here, which makes conventional or even unconventional analysis somewhat pointless. Sentiment has hijacked the market, which leaves the door wide open to all sorts of unpredictable outcomes. The smart money move here is to take things one day at a time, be smart, and maybe even stay on the sidelines. When we got this kind of move in late 2008, stocks bounced a little, but still managed to move even lower a few weeks later.
The good news is, once things normalize, this wild pullback will dish out big upside moves. It's just a question of when they'll take shape.


