
Weekly Market Outlook - New Highs Dead Ahead, If The Bulls Have The Guts
It's curious. Renewed hope on the trade front meant stocks ended the week on a high note, capping off a third straight week of gains. Last week's rally, in fact, was the biggest of the three. On the other hand, Friday's high for the S&P 500 suspiciously matched the peak from September, as well as the peak from July. Perhaps traders are still concerned about the mental line in the sand they've drawn for themselves.
That's what makes this week such an important one. The bulls are either going to have to put up, or shut up. This is a time of year when stocks should be weak, but if they're going to buck the trend, they're likely to do so in a big way.
We'll look at the matter in detail below - as always - after reviewing last week's economic news and previewing this week's litany of announcements.
Economic Data Analysis
Last week was a light one in terms of economic news, but we did round out October's batch of lackluster real estate data. Existing home sales fell, and fell short of expectations. New-home sales, meanwhile, were more or less in line with estimates and August's pace. We really needed to see another month of growth on that front, however.
New, Existing Home Sales Charts
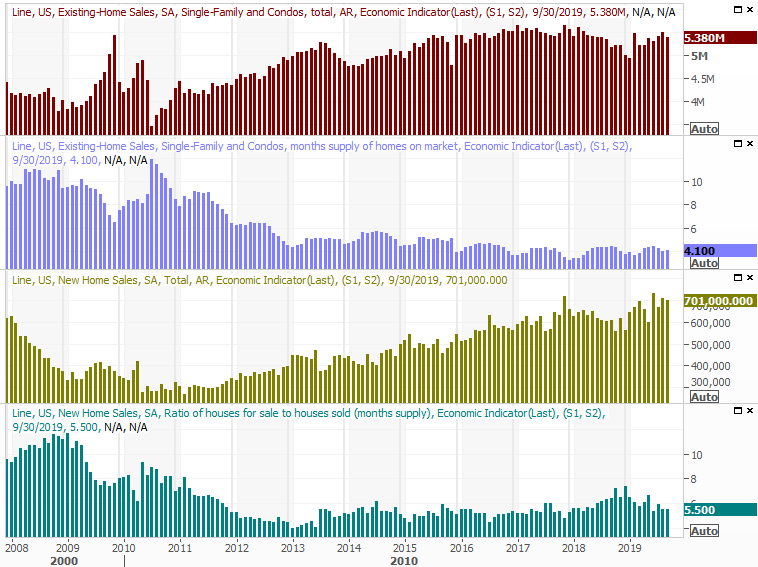
Source: Thomson Reuters
We also got August's update for the FHFA Housing Price Index. The Case-Shiller report won't be released until this week, even so, odds are good it too is showing a price slowdown.
FHFA, Case-Shiller Home Price Charts
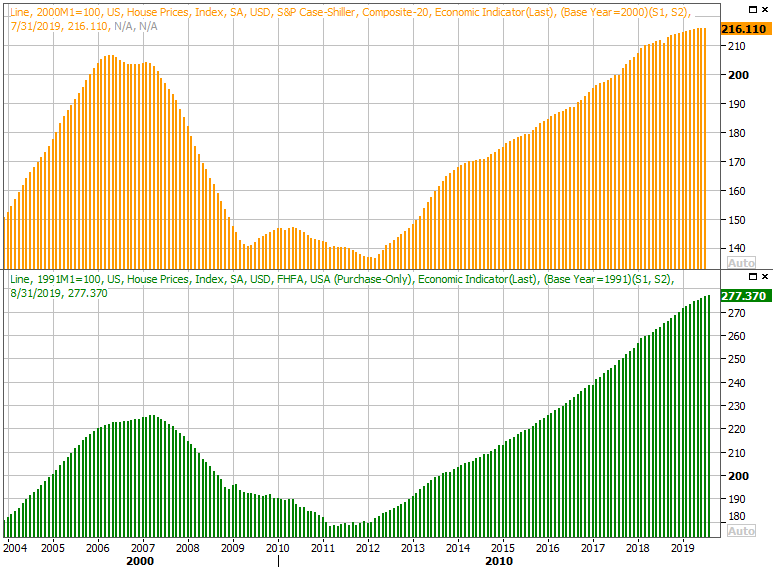
Source: Thomson Reuters
Yes, it's August data, and it's conceivable the real estate market perked up in the meantime. It's not likely though. Real estate is a slow-moving market, and it's not very often trends stop shortly after they start.
Finally, on Friday we got the third and final look at the University of Michigan sentiment index, perhaps serving as a preview of this week's October reading of the Conference Board's comparable figure. The Michigan figure was actually up pretty nicely, for a second month in a row, and economists are saying the Conference Board's measure will rise as well. Neither are rising as firmly as one would like, but to see any uptick in this environment is telling.
Consumer Confidence, Michigan Sentiment Index Charts
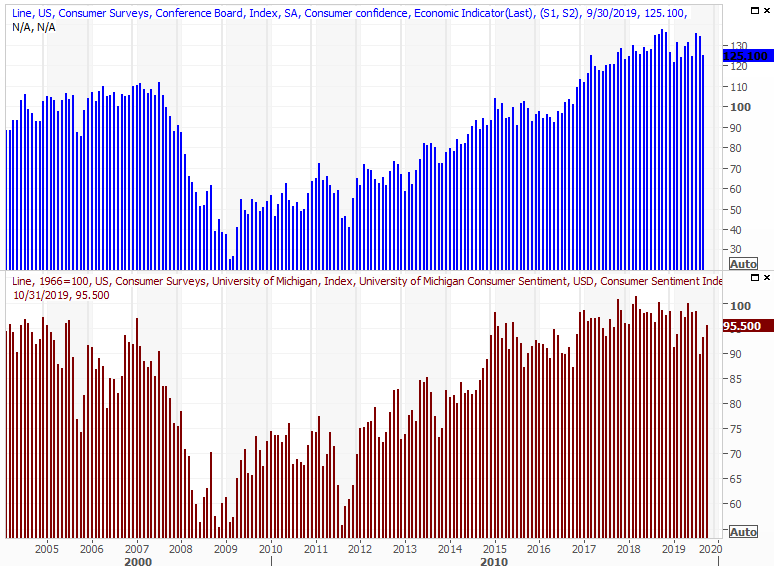
Source: Thomson Reuters
Everything else is on the grid.
Economic Calendar
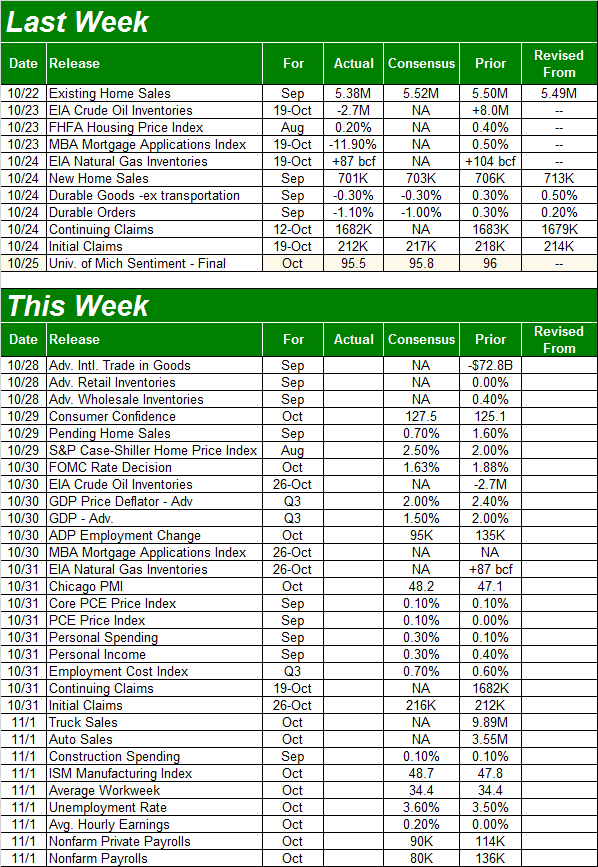
Source: Briefing.com
This week is going to be especially busy. Aside from the aforementioned data in the lineup, we're getting several more biggies... all of them crammed into the last three days of the week.
Wednesday's market-movers will be the interest rate decision from the Federal Reserve, and the first GDP growth estimate for Q3. Economists believe economic growth for the third quarter slipped from 2.4% to 2.0%, which is part of the reason the market says there's a 93% chance the FOMC will lower its target rate by a quarter of a point.
GDP Growth Rate Chart

Source: Thomson Reuters
There's not a whole lot on the menu for Thursday, but a big day on Friday will make up for lost time. That's when we'll get October's auto sales figures, and October's jobs report.
As for vehicle sales, continued deterioration in sales of passenger cars continues to be offset by demand for trucks and SUVs. But, somehow it feels like the whole market is hanging by a thread... as if it needs to go through a cyclical reset.
Automobile Sales Charts
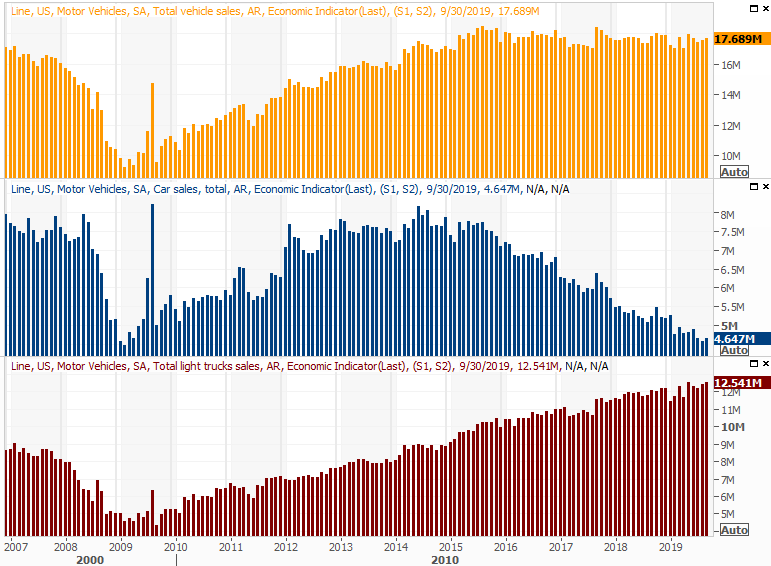
Source: Thomson Reuters
Finally, the pros don't think the economy will be able to log the kind of impressive jobs growth we saw in October. In fact, analysts are modeling a slight uptick in the unemployment rate, from 3.5% to 3.6%. As has been the case for months though, know that even a 3.6% unemployment rate is impressive, and that there are more meaningful indicators of employment strength right now than net growth. Namely, wages and wage growth are the key, particularly for the segment of the population that are generally not well paid.
Payroll Growth, Unemployment Rate Charts
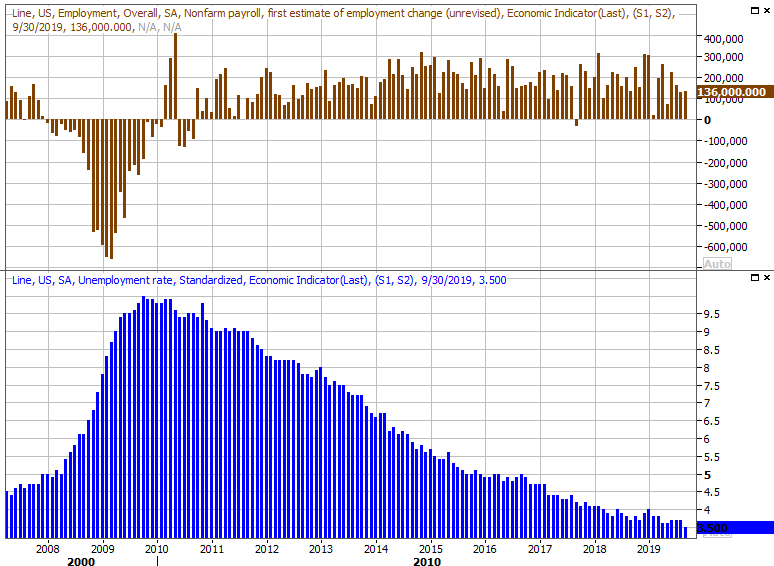
Source: Thomson Reuters
Stock Market Index Analysis
The indices are rolling along, but they're almost out of room to run.
That's the short version of a long story. Here's the long, full-blown version.
Investors were stoked on Friday, sending the S&P 500 up a healthy 0.41%. That translates into a 1.2% gain for the week. However, Friday's high of 3027.39 is curiously aligned with the peak prices from September as well as July. Traders may have drawn a mental line in the sand there.
S&P 500 Daily Chart, with VIX, Volume
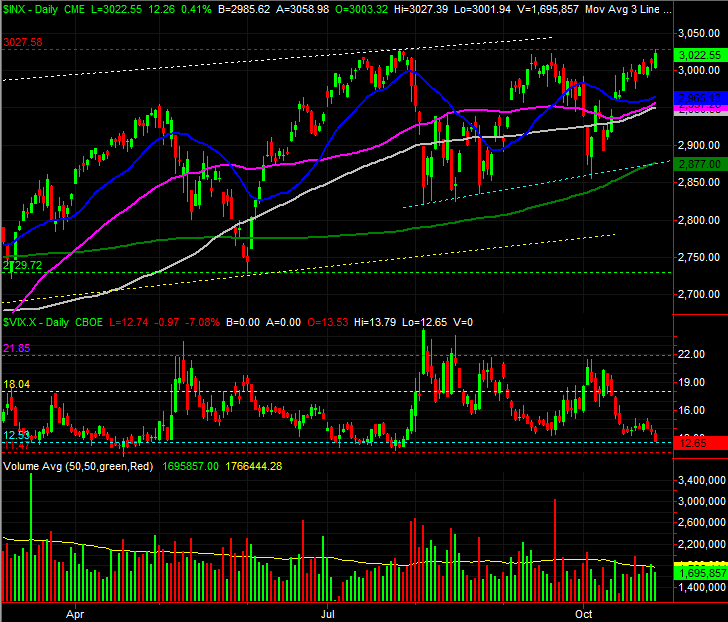
Source: TradeStation
That doesn't inherently mean the rally has to come to a close here. It's one possibility, but one of several. It's also possible the bulls are biding their time and waiting for an opportune time to break out. The string of higher lows since June's low is good evidence that the bulls have been gearing up for such a move. Eclipsing 3027.6 is the key though. None of the potential rally matters until that level is hurdled, and with the VIX as low as it is, that's not going to be easy.
Also notice that while the undertow is respectably bullish, there's not a great deal of volume behind it.
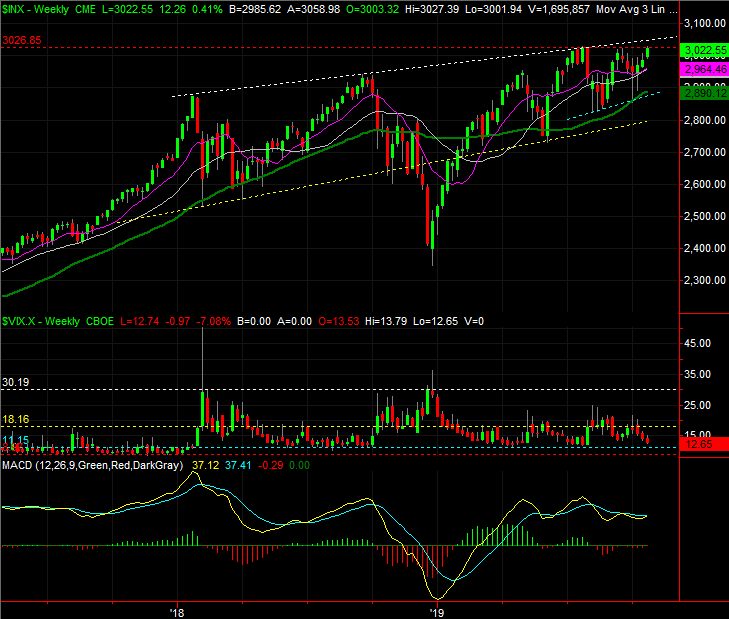
The weekly chart of the S&P 500 puts things in perspective, for better or worse. From this perspective, there's a slight hint of a rising, converging wedge pattern framed in white and blue dashed lines. That's another clue of a slow, bullish buildup.
S&P 500 Weekly Chart, with VIX, Volume
Source: TradeStation
There's a second, in-between possibility on the table. The S&P 500 could push past the technical ceiling at 3027, but only to test the upper boundary of the converging wedge shape currently at 3052 (and rising). That would be just enough time and room for the VIX to slide all the way back to its absolute floor around 11.5. Then the market could roll over again, repeating a pretty well established pattern.
The good news is, there's some pretty dependable technical support waiting for the S&P 500 around 2900. That's where the green 200-day moving average line awaits, paired with the floor that connects all the key slows since August.
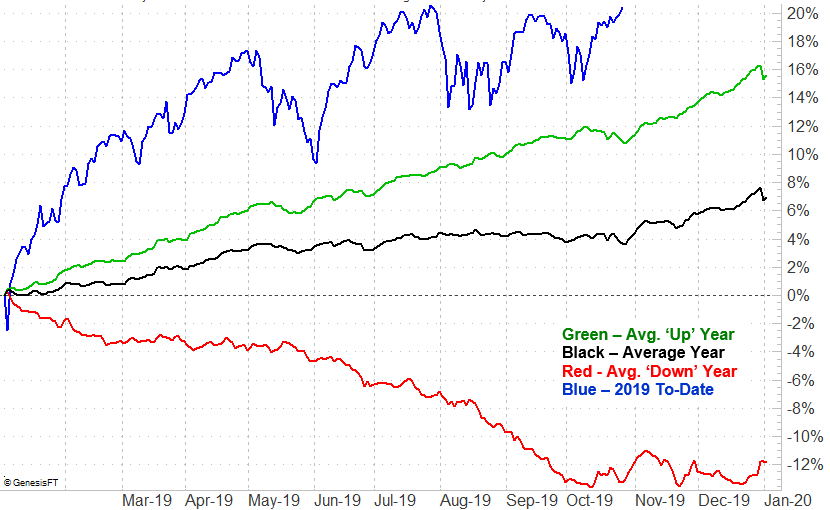
Here's the problem with all three possibilities (a pullback, a breakout, and a little more bullishness before a pullback): The calendar says we should have already made a clear pullback and started the usual year-end- bullishness. We never started with the advantage of September/October weakness.
S&P 500 Average Annual Day-by-Day Performance
Source: TradeNavigator
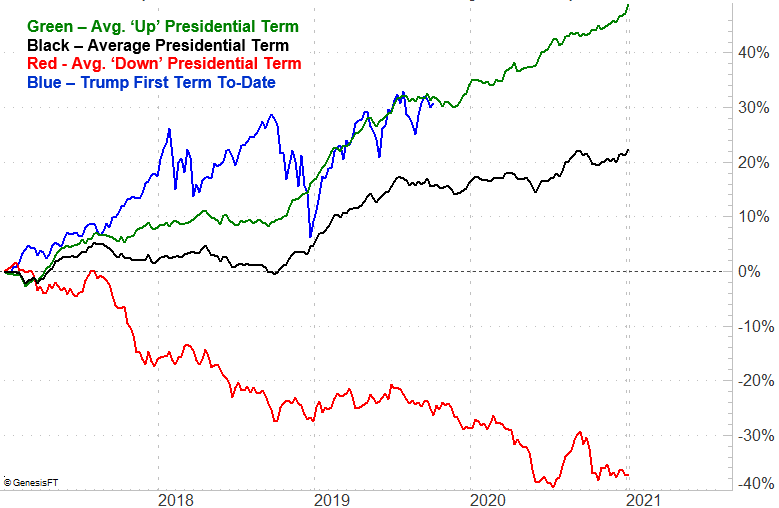
Here's the problem with that problem -- things are a little bit different in the third year of a presidential term, as the next election starts to take shape. In these years, the market remains weak through mid-November and then starts to rally... not that we're following this usual path either.
S&P 500 Average Presidential Term Day-by-Day Performance
Source: TradeNavigator
Maybe it doesn't matter at all. Investors are pretty well primed to ignore any historical precedent, and for that matter, ignore the unusual bullishness we've seen since the end of last year. That can be powerful in and of itself.
Unfortunately, we can only wait and see how all of this pans out.


