
Weekly Market Outlook - Did Bear Crush Santa Claus Rally?
Weekly Market Outlook
Despite ending the first week of December on a bullish foot, the bears started - and finished - last week in charge of things... to say the least. Last week's -3.8% pullback was the biggest weekly loss for the S&P 500 (SPX) (SPY) since the heart of the August meltdown. Perhaps worse, the pullback broke some key support levels, and there isn't much other support until we get back to the August lows.
On the flipside, between the time of year a Santa Claus rally usually takes shape and the possibility that traders are preemptively getting any rate-hike selling out of the way (leaving only the would-be buyers behind), there's still a good chance stocks could reverse this bearish course with little to no warning. It is, after all, the way things have been for the reversal-prone market all year long.
We'll look at the details after a quick run-down of last week's and this week's economic news.
Economic Data
It was a fairly busy week last week, on the economic front, though nothing heavy-hitting came until Friday when we got a double-dose of big news... last month's retail sales, and last month's producer price inflation rate (which in many regards is a preview of next week's consumer inflation rate). Both showed decent economic strength.
Producer price inflation edged 0.3% higher, with and without the costs of food and energy factored in. Both were notably better than the figures predicted by economists. On an annualized basis, PPI stands at -1.2%, though on a core basis is stands at a healthier 0.5%.
Annualized Producer Price Inflation Chart
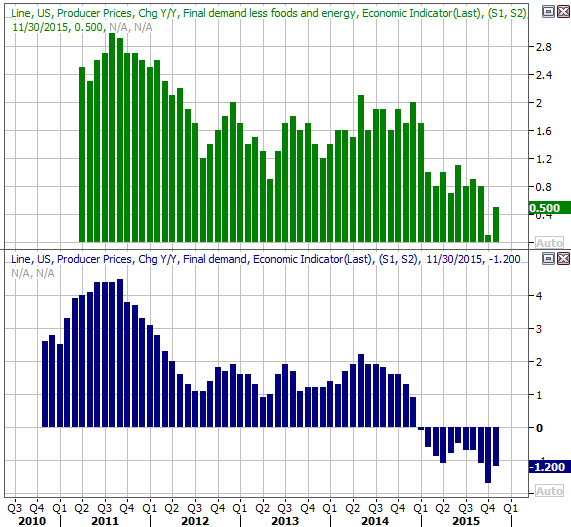
Source: Thomas Reuters
As for retail sales, they were up too, roughly as expected. Overall consumer spending was up 0.2% last month (versus an expectation of 0.3% growth), and were up 0.4% when not counting automobile sales (again, versus an expectation for 0.3% growth). On a year-over-year basis, we're still mostly seeing growth, though the extent of that growth is waning... and not just because of slowing auto sales.
Year-Over-Year Retail Spending Growth Chart

Source: Thomas Reuters
All the other data is on the following grid:
Economic Calendar
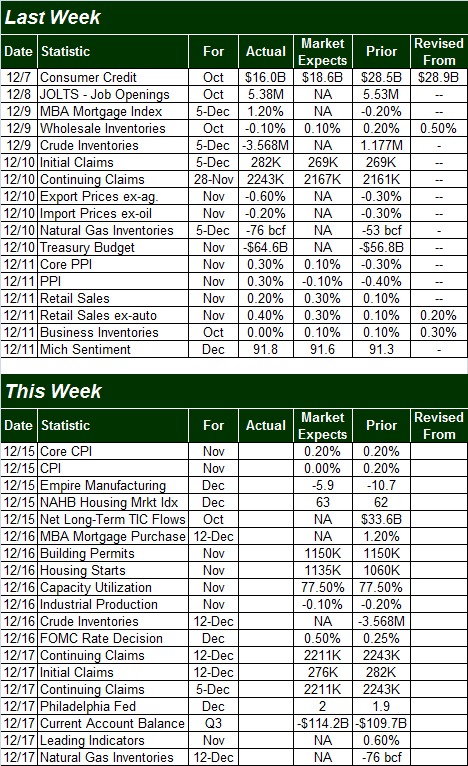
Source: Briefing.com
This week will be a little busier, kicking off with last month's consumer inflation data on Tuesday. The pros are calling for a modest 0.2% upswing in consumer inflation on a core basis, but are expecting no change in prices overall.
Consumer Price Inflation Chart

Source: Thomas Reuters
On Wednesday we'll get an update on the housing market, via November's housing starts and building permits. The bigger trend has been a positive one, even if a little turbulent lately. Economists are expecting permits to be flat with October's levels, and are calling for a slight dip in starts. A poor or strong showing here could make a real difference for stocks.
Building Permits and Housing Starts Chart
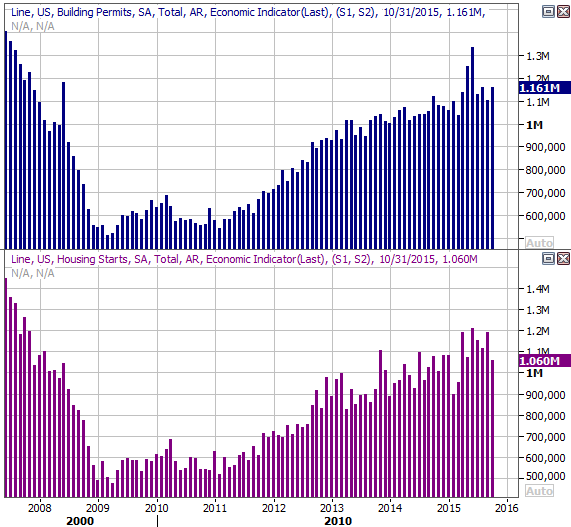
Source: Thomas Reuters
We're also going to hear about October's capacity utilization and industrial productivity on Wednesday, though all of Wednesday's data will pale in comparison to the Fed's rate-hike decision due that day. Be sure to be ready.
Stock Market Index Analysis
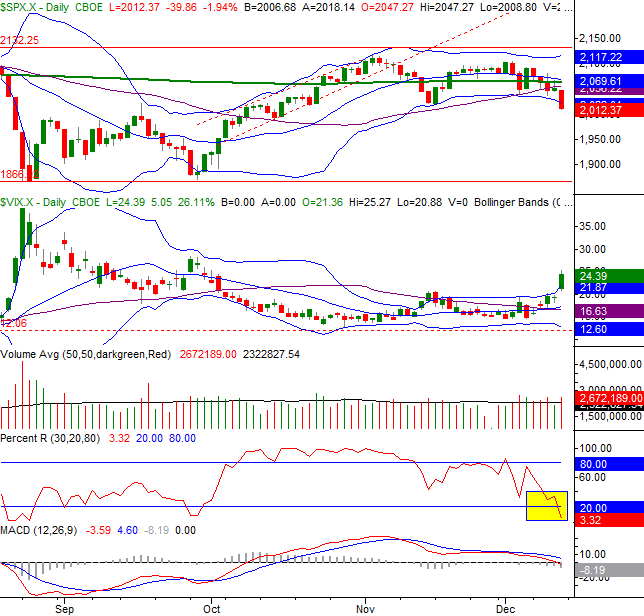
After teetering on the edge of a significant corrective move for more than a month, the weight of the rapid gains reaped in October finally proved to be too much. Friday's plunge pulled the S&P 500 below all of its key support levels.... including the lower 20-day Bollinger band. The 20-day moving average line is also on the verge of breaking back under the 200-day moving average line, confirming bearish momentum is taking hold.
S&P 500 & VIX Daily Chart
Chart created with TradeStation
There are plenty of other technical bullish cues as well, like the fact that the CBOE Volatility Index (VIX) (VXX) firmly broke above its upper Bollinger band, the MACD lines (both of them) are close to breaking below the zero level, and the Percent R line fell under the 20 level.
None of these clues are completed signs of a new bearish trend, but they are the beginning of bearish clues. What happens this week could confirm the downtrend has taken hold. The Percent R line - arguably the key indicator we're watching now - will confirm bearishness by moving higher without breaking above 20 and then moving lower again on the same day the S&P 500 makes a lower low.
Note that it's possible the S&P 500 could push its way back up to the 2065 level where almost all of the key moving average lines are converging and it still wouldn't rekindle the uptrend. The S&P 500 will have to move above 2065 to truly entertain bullish notions.
It's also worth noting the BigTrends TrendScore on stocks just moved from a 'caution' to 'bearish' reading as of Friday's close -- that indicator is a combined Daily/Weekly one.
Zooming out to a weekly chart of the S&P 500 we don't see anything differently, but we do gain more perspective. Namely, we can see the VIX has pushed above an important ceiling while the S&P 500 still isn't at any major support line.
S&P 500 & VIX Weekly Chart
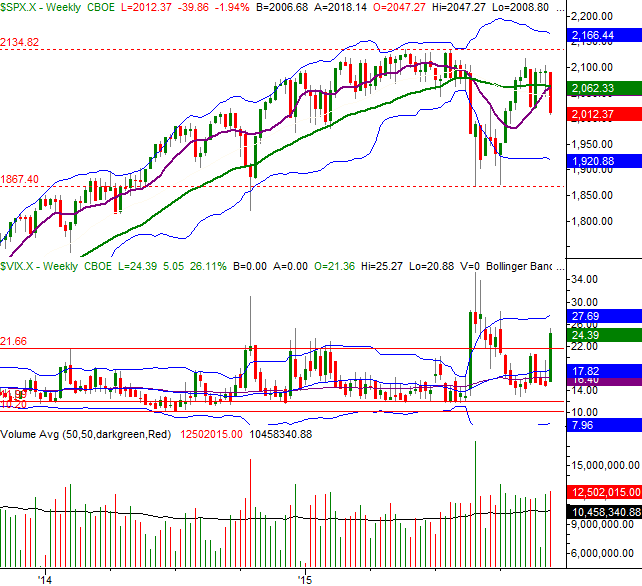
Chart created with TradeStation
That being said, the NASDAQ Composite (COMP) is equally worth watching right now (if not more so). A major near-term support line is now being tested, in the shadow of a recent cross under its moving average lines. We may get a bounce early this week, just to fill in the gap left behind at Friday's open. But, don't get too excited just yet. The NASDAQ could still break under that near-term support (red, dashed) and end up gunning for the lower, longer-term support line (black, dashed).
NASDAQ Composite & VXN Daily Chart
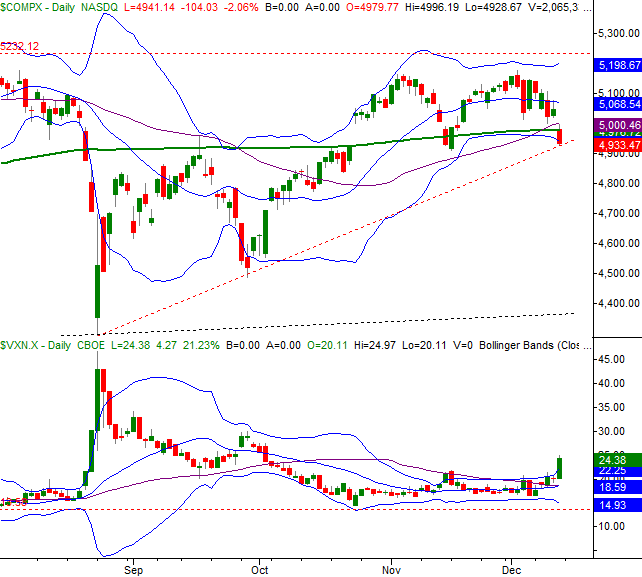
Chart created with TradeStation
While it's not clear which direction the market will head this week (and may not head anywhere until after Wednesday's interest rate news), there's no denying it's going to be a pivotal week for stocks.
Trade Well,
Price Headley
Disclosure: None.

Comments
 No Thumbs up yet!

