
Weekly Market Outlook: Corporate Earnings And PMI Figures Take Center Stage
It's a big week ahead filled with a large number of corporate third-quarter earnings announcements from US companies and a few European companies as well. This includes the likes of heavyweights such as:
Of course, stock markets will also be fully focused on election polls which have Joe Biden leading Donald Trump.
Elsewhere, there are big announcements from both China and the European Union. Early on in the week, China's Gross Domestic Product (GDP) is forecasted to rise to 5.5% as its economy gathers pace while Western economies slow down with new lockdown restrictions. Only last week, China's stock market surged to a record high valuation of more than $10 trillion.
On Friday, traders will most likely be focused on the expected drop in French and German Flash Services and Manufacturing PMI figures. In this case, it will be making sure it hasn't fallen too far. Anything below 50 shows an economy is contracting but these figures won't include the impact of the recent lockdown restrictions.
Weekly News
- Markets anticipate a potential 'blue wave' victory for Democrats as Biden leads Trump in polls.
- Investors look ahead to stocks in infrastructure which could benefit from the next round of US stimulus measures.
- China's stock market surges to a record high valuation of more than $10 trillion.
- ECB President Christine Lagarde states more stimulus is ready if new lockdown restrictions in Europe depress the economy.
- UK Prime Minister Boris Johnson reiterates he is 'preparing the UK for no-deal Brexit' but a new round of negotiations is due to take place this week in London.
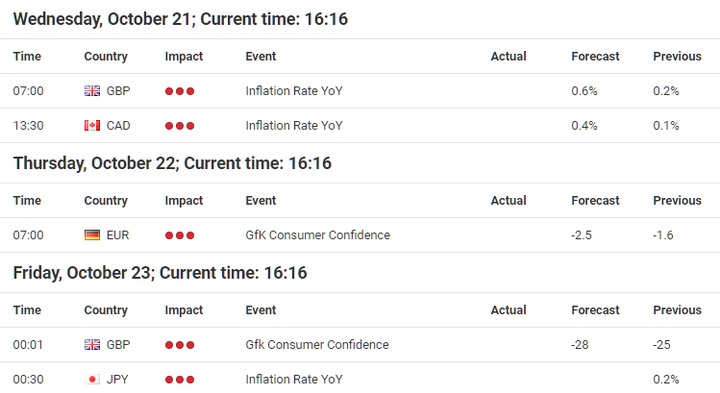
Source: Forex Calendar provided by Admiral Markets UK Ltd.
So, it is setting up to be another very interesting week in the markets with news affecting most asset classes. One of the best ways to prepare is to make sure you have the right tools at your disposal.
Trader's Radar - French and German Flash Services and Manufacturing PMI
Traders will undoubtedly be focused on the impact of the new lockdown restrictions gripping many major European economies as the rate of coronavirus infections rises. This could have an impact on the euro and stock markets which are going to be in focus due to a wave of European earnings announcements this week (discussed in the next section).
However, traders will also be focused on this week's European Purchasing Managers Index (PMI) figures. PMI figures are considered a high impact news release as it is an index based on a survey of purchasing managers in the industry. As businesses react the quickest to changing market conditions, purchasing managers hold key insights into the state of an economy. A figure of above 50 indicates the economy is expanding and below 50 means it is contracting.
- Friday 23 October:
- 8.15 am BST French Flash Services PMI, expected 46.8
- 8.30 am BST German Flash Services PMI, expected 49
- 8.30 am BST German Flash Manufacturing PMI, expected 55.5
Any surprises in these figures could cause some huge moves in the euro which was already on the backfoot in last week's trading due to a resurgent US dollar. Over the summer period, the Eurozone economy posted some impressive figures suggesting a rebound was underway which led to a rise in the euro. This caused some ECB members to express concern about the impact of a high euro for European company profits.
However, PMI numbers are expected to be lower this week and this does not even include the impact of the recent lockdown restrictions for most European countries. For the most part, the EURUSD exchange rate could remain range based until more clarity is given after the US presidential election or any new actions from the ECB.
(Click on image to enlarge)
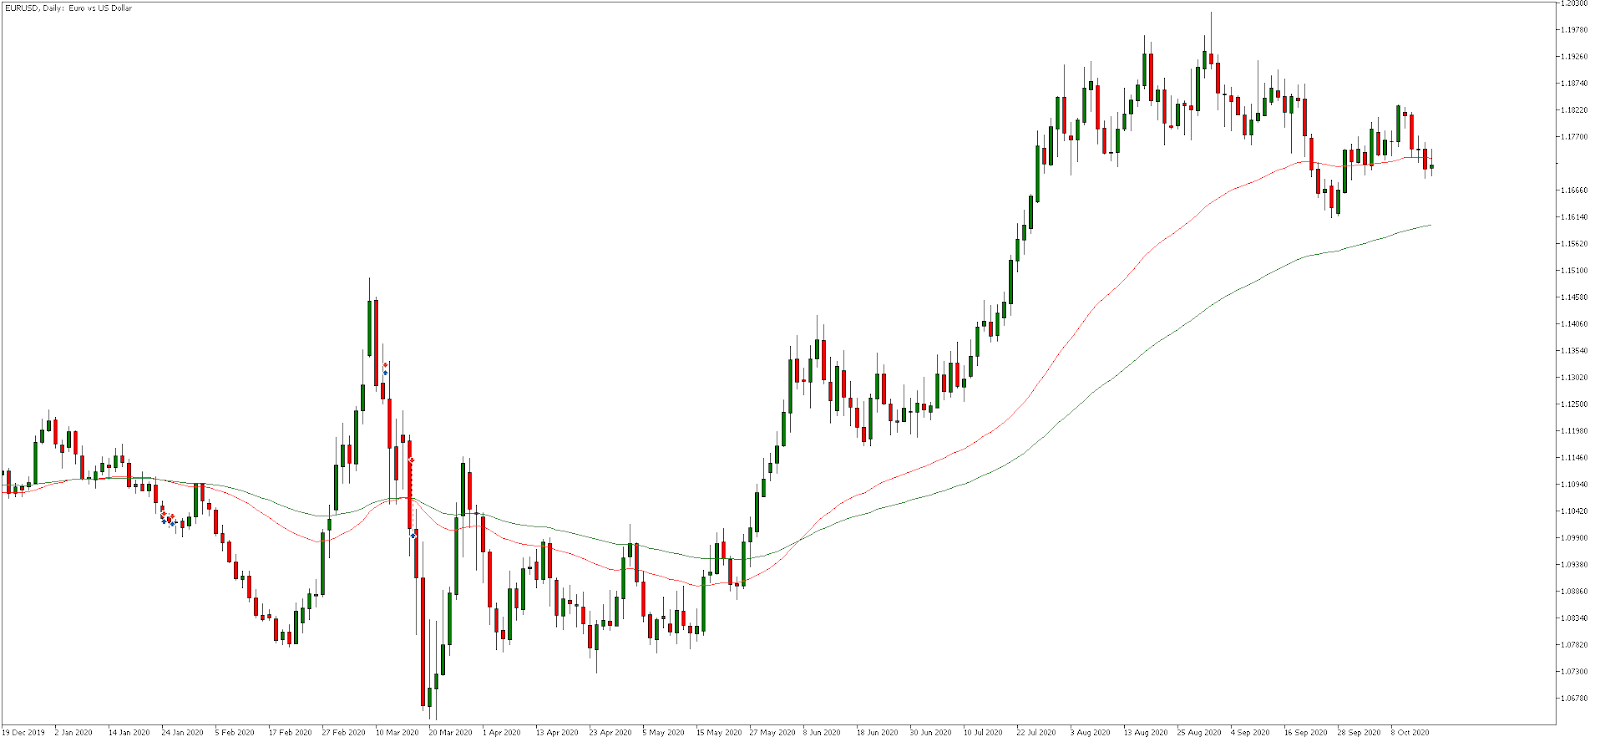
Source: Admiral Markets MetaTrader 5, EURUSD, Daily - Data range: from Dec 19, 2019, to Oct 19, 2020, performed on Oct 19, 2020, at 6.00 am BST. Please note: Past performance is not a reliable indicator of future results.
Last five-year performance of EURUSD: 2019 = -2.21%, 2018 = -4.47%, 2017 = +14.09%, 2016 = -3.21%, 2015 = -10.18%, 2014 = -12.23%.
In the above daily price chart of EURUSD, it's clear to see the rally higher before and during the summer period as actions from the European Central Bank helped steer the market. It also helped that this was the worst period so far for the US which caused a significant sell-off in the US dollar.
Since traders have returned after the summer, the exchange rate has remained in a sideways trading range. This could open the doorway for mean-reversion type trading strategies. It is likely traders will be waiting for more certainty on the outcome of the US election and the size of a new stimulus plan for direction on the US dollar.
Equally, traders may be keeping an eye on the ECB for any new policy actions which could drive the euro to diverge from the dollar.
Corporate trading updates and stock indices
Most global stock market indices closed last week at similar levels to where they started at the beginning of the week. It seems investors will want to take stock of the third-quarter earnings reports scheduled for this week and next.
China's stock market has bucked the trend surging to record high valuations that surpassed $10 trillion as the economy is reportedly now back on track with very few coronavirus cases.
Some heavyweight companies reporting this week, include:
- Monday - IBM, Halliburton
- Tuesday - Procter & Gamble, Philip Morris, Snap, Netflix
- Wednesday - Verizon, Tesla, Ericsson
- Thursday - Unilever, American Airlines, Intel, Coca-Cola
- Friday - American Express, Barclays, Renault, Daimler
Individual stock prices tend to be quite volatile during earnings announcements while global stock indices tend to diverge from each other from a strength and weakness standpoint. US stock markets have continued to outperform their European counterparts for some time. However, last week the S&P 500 stock market index struggled to hold on to the early gains of the week, as shown below:
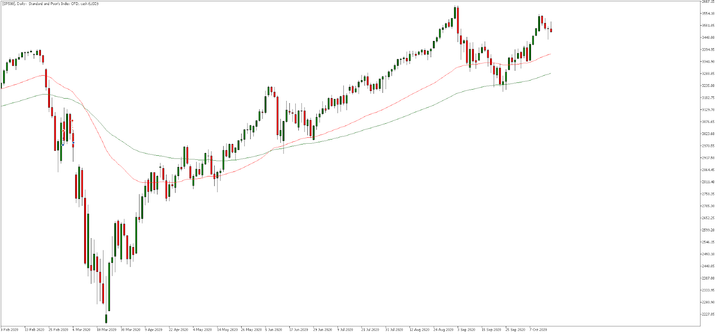
Source: Admiral Markets MetaTrader 5, SP500, Daily - Data range: from February 3, 2020, to October 19, 2020, performed on October 19, 2020, at 7:30 am BST. Please note: Past performance is not a reliable indicator of future results.
Last five-year performance of the S&P 500 circa: 2019 = +29.09%, 2018 = -5.96%, 2017 = +19.08%, 2016 = +8.80%, 2015 = -0.82%, 2014 = +12.32%
In the daily price chart above, it is clear to see the recent trend higher. After the return from summer, however, the price has tended to trade with more volatility and price swings. Traders will now be eyeing key retracement levels for potential 'buy the dip' opportunities but may also be prepared for further weakness if price breaks through the green 100-period exponential moving average.
Disclaimer: The given data provides additional information regarding all analysis, estimates, prognosis, forecasts or other similar assessments or information (hereinafter "Analysis") ...
more

