
Weekly Market Outlook: Central Banks And PMI Figures In Focus
It's a big week for European economic data with France and Germany due to release Flash Manufacturing and Services PMI (Purchasing Managers Index) figures on Wednesday. There have been some red flags in recent weeks that the Eurozone recovery story is coming to an end. Most PMI figures are expected to slip and are barely holding above 50, which is a key level as it represents an expanding economy.
This week on Thursday, US Federal Reserve Chairman Jerome Powell is due to testify before the House Select Committee in Washington DC on the economic impacts of Covid-19. While the Fed has already stated it will keep rates at record lows at least until 2023, any changes regarding this will be of interest to traders.
Of course, traders will still be keeping an eye out on the major themes that are still gripping the financial markets. These include:
- The upcoming US presidential election
- Brexit talks
- The possibility of a second wave of the coronavirus.
Therefore, levels of volatility in the Forex market may still remain elevated so risk management should be the hallmark of any trading strategy this week.
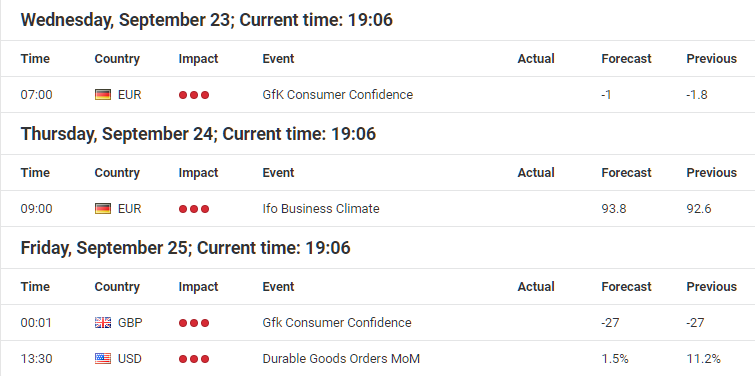
Source: Forex Calendar provided by Admiral Markets UK Ltd.
Global stock indices continue to range trend as investors weigh up lofty stock valuations against the upcoming US presidential election and possibility of a second wave of the coronavirus. While European stock market indices have traded in a range for some time, US stock market indices continued to trend. However, investors are now being much more selective regarding the sectors they choose to invest in with many of them diverging in strength and weakness.
Key economic reports and markets to watch
Eurozone Manufacturing and Services PMIs
This week is full of high impact economic news announcements for the Eurozone, which could cause some wild movements in both the Euro and European stock market indices. On Wednesday there are the following releases:
- 8.15 am BST - French Flash Services PMI
- 8.30 am BST - German Flash Manufacturing and Services PMI
In recent months, the euro has surged higher due to the Eurozone recovery story. However, recent indicators have suggested that the recovery is starting to slow. This month's figures are hugely important for analysts to ascertain whether a pattern is developing to the limit of economic activity that can take place during a pandemic and with lockdown limitations still in place.
Traders have already priced in a drop in some of the PMI figures but the world will be watching. The EURUSD currency pair has traded in a range since the end of July after a huge surge higher. Much of the Eurozone recovery story has already been traded and traders will be looking for hard data to support their views on whether the recovery is still in place or starting to wane.
(Click on image to enlarge)

Source: Admiral Markets MetaTrader 5, EURUSD, Daily - Data range: from January 6, 2020, to September 20, 2020, performed on September 20, 2020, at 6.00 pm BST. Please note: Past performance is not a reliable indicator of future results.
Past five-year performance: 2019 = -2.21%, 2018 = -4.47%, 2017 = +14.09%, 2016 = -3.21%, 2015 = -10.18%, 2014 = -12.23%.
In the daily chart of EURUSD shown above, it's clear to see the recent range that has developed since the end of July. This is after the strong rally higher which originated in March and which led EURUSD to surge roughly 12% higher until September 1. Traders will be looking for events which could help the currency pair break from this trading range and either continue to trend higher or reverse the recent trend up.
While much will depend on the state of the Eurozone, traders also need to look at the US. While the Fed has already stated that they will keep rates at record lows for quite some time, traders will be on edge to see whether the US or Europe will be dealing with a second wave first. The upcoming presidential debate on September 29, could also play a big part in the direction of the dollar.
Corporate trading updates and stock indices
In recent months, US indices continued to trend higher while European indices continued to trade in a range. However, in the past few weeks and after key announcements from the European Central Bank and US Federal Reserve, most global stock indices have been trading in a range as the daily chart of the S&P 500 stock market indices shows below:
(Click on image to enlarge)
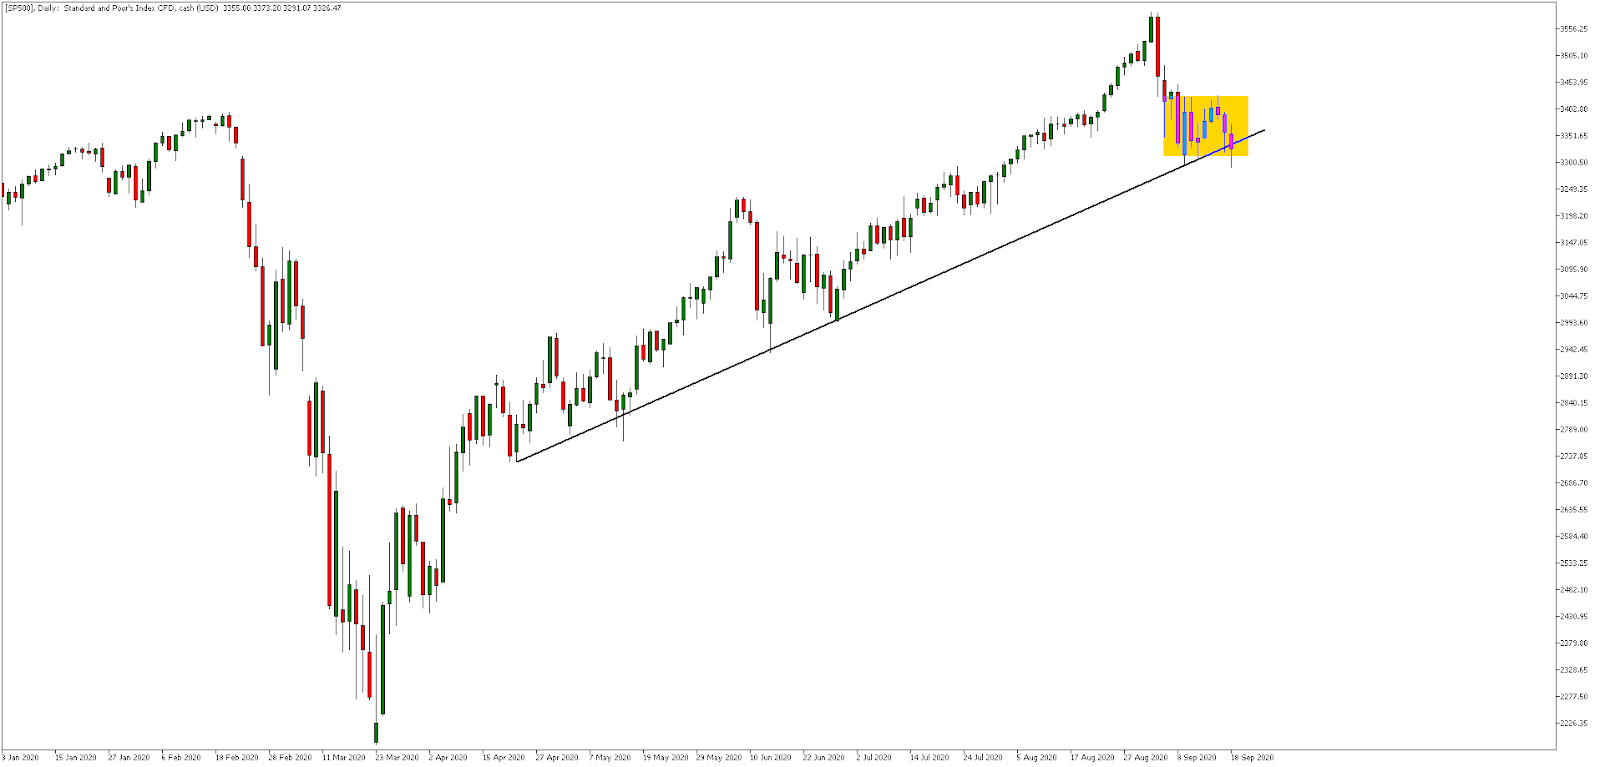
Source: Admiral Markets MetaTrader 5, SP500, Daily - Data range: from January 3, 2020, to September 20, 2020, performed on September 20, 2020, at 7.30 pm BST. Please note: Past performance is not a reliable indicator of future results.
Last five-year performance: 2019 = +29.09%, 2018 = -5.96%, 2017 = +19.08%, 2016 = +8.80%, 2015 = -0.82%, 2014 = +12.32%
In the daily chart of the S&P 500 index shown above, it's clear to see the price range that has developed in the yellow box. This also happens to be at a multi-month ascending trend line as shown by the black line. Traders will be looking for a catalyst on whether the price will break this trend line for a long-awaited correction, or whether the price will bounce from this level and continue in the trend higher.
Interestingly, the price of the S&P 500 stock market index is trading around the same price level as the previous all-time high level reached in February 2020, just before the sell-off during the coronavirus pandemic. There is also a chance that the price may stabilise at this key level while traders digest the first US presidential debate on September 29, and the candidates' key policies.
Disclaimer: The given data provides additional information regarding all analysis, estimates, prognosis, forecasts or other similar assessments or information (hereinafter "Analysis") ...
more

