
Weekly Market Outlook – Time To Check Under This Rally’s Hood
The bulls couldn't keep the rally going for a third straight week. Having reached a little too deep into record territory, the S&P 500 lost about 0.7% of its value for the holiday-shortened week.
Still, it's hardly the beginning of a new downtrend. All the indices remain well above their key moving averages, having built up plenty of cushion from the rally born out of the late-January pullback. There's more room to keep falling as well, without snapping the uptrend. On the flipside, we're seeing much more selling volume than buying volume, even though we saw more advancers than decliners on Friday; that may have been the result of a wave of option expirations.
We'll look at that red flag in a moment. First, let's recap last week's most important economic announcements and see what's in store for the week ahead.
Economic Data Analysis
It was a busy week in terms of economic news, and for the most part, an encouraging one. In order of appearance:
We know economic activity is accelerating, but it appears we've underestimated just how quickly it would recover. The nation's capacity utilization improved from 74.9% to 75.6%, easily surpassing estimates of 74.9%; December's final tally was also revised upward. And industrial production grew 0.9%, topping expectations of a 0.6% improvement. That's a slowdown from December's 1.3% increase, though progress all the same. Both measures remain below their pre-pandemic peaks, but are recovering well.
Capacity Utilization and Industrial Productivity Charts
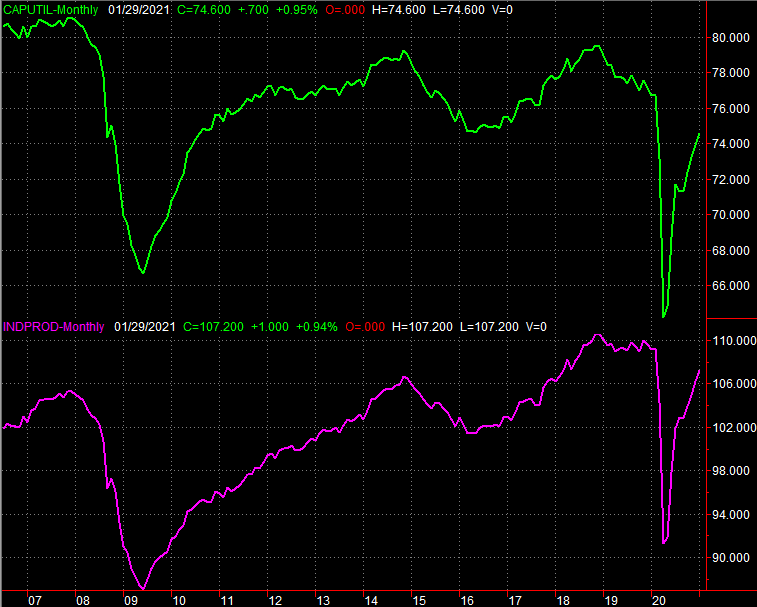
Source: Federal Reserve, TradeStation
In this same vein, retail sales also recovered in a big way last month following December's surprising lull. Overall retail consumption grew 5.3%, and when taking automobile purchases out of the picture, retail spending was up 5.9% year-over-year.
Retail Sales Growth Charts
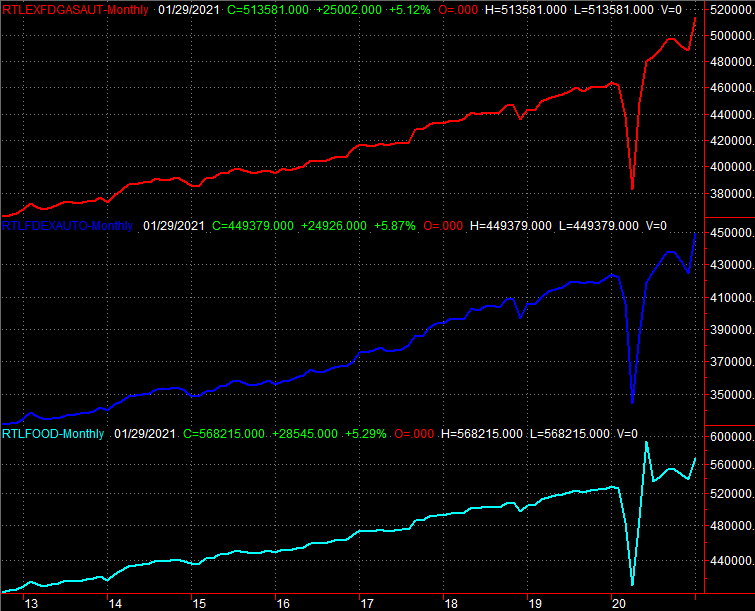
Source: Census Bureau, TradeStation
Food spending -- restaurants -- remains a weak link for the obvious reasons. With the COVID-19 vaccines seemingly starting to get traction, though, this isn't a concern. The food component of the retail spending mix hasn't exactly been poor in recent months.
And it's not rising prices keeping food or any other consumer spending in check -- at least not yet. While producer inflation accelerated in January, it's still contained. Annualized, producer prices were only up 1.3%, and only higher by 1.2% when not considering food and energy costs. Both producer and consumer inflation remain below average levels despite the flood of stimulus cash in people's pockets.
Consumer and Producer Inflation Charts
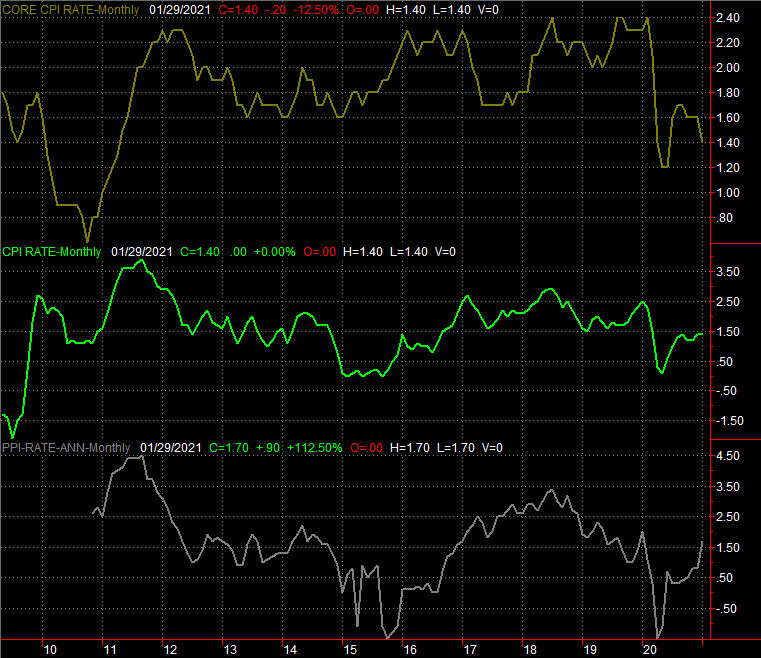
Source: Bureau of Labor Statistics, TradeStation
The only disappointment in last week's economic news was offset by its corresponding data nugget. Housing starts slumped to a yearly pace of 1.58 million, down from December's 1.68 million, and falling short of estimates. Building permits, however, soared from 1.7 million to 1.88 million. That's the best reading since 2006, when it was on the way down. Either way, both figures and their respective bigger trends are very healthy.
Housing Starts and Building Permits Charts

Source: Census Bureau, TradeStation
Everything else is on the grid.
Economic Report Calendar
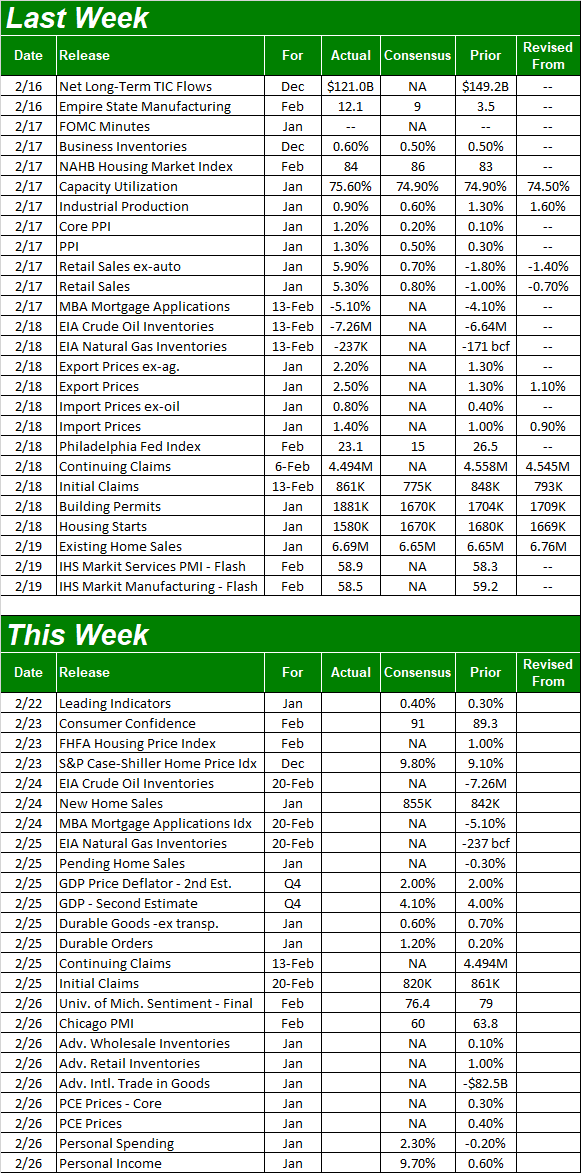
Source: Briefing.com
This week will be almost as busy, rounding out the real estate picture. On Tuesday look for housing price data. Though there's no estimate yet for the FHFA Housing Price Index, it's been closely mirrored by the S&P Case-Shiller Home Price Index, which is expected to come in 9.8% better than year-ago levels. Both measures have been on the rise for some time now. (Note that this week's reports will be looking at December's data, so it's a bit dated. Still, the trends are impressive.)
Housing Price Index Charts
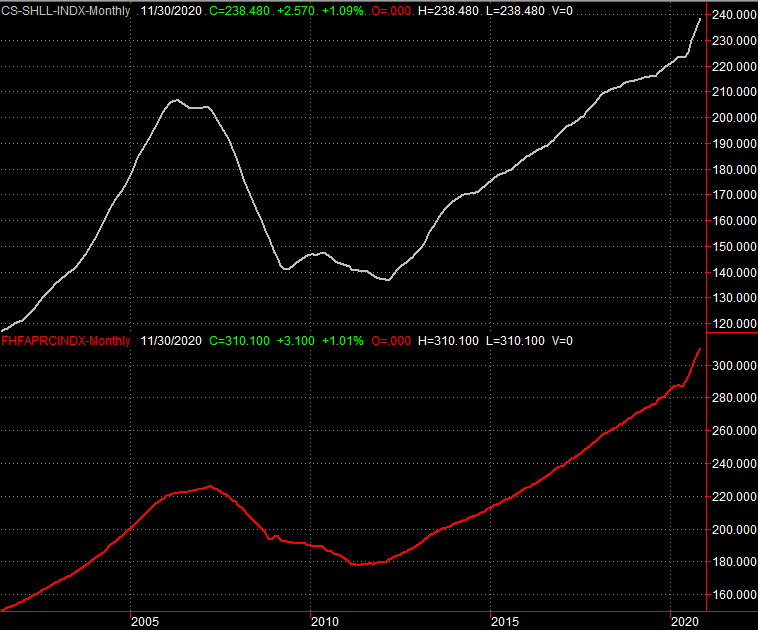
Source: Standard & Poor's, FHFA, TradeStation
It's also a big week for consumer sentiment. On Tuesday we'll hear from the Conference Board, and on Friday we'll get the third and final report from the University of Michigan regarding its consumer sentiment measure. Both have been disappointing in recent months, and inconsistent from one another. That's not expected to change this month.
Consumer Sentiment Charts
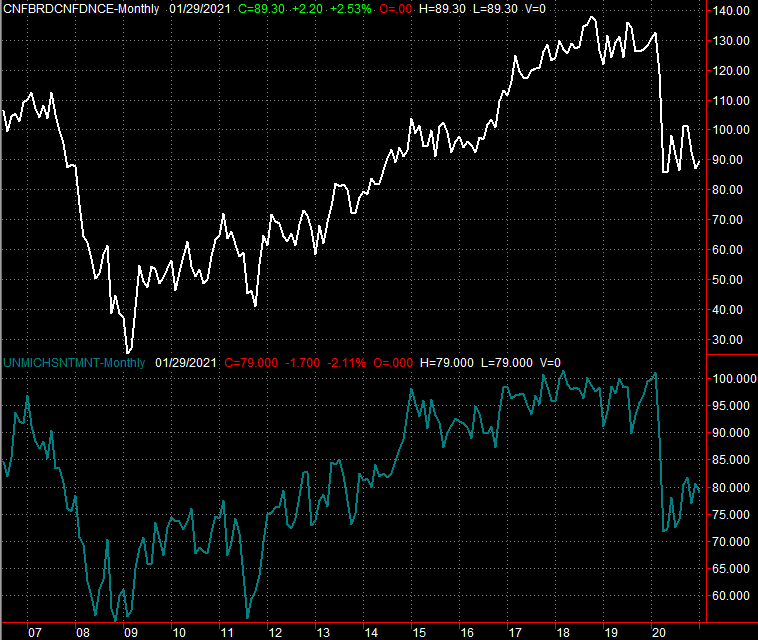
Source: University of Michigan, Conference Board, TradeStation
Also pay attention on Thursday to the second GDP growth estimate for Q4. Economists still peg it at 4.0%, but a variation from that first guess could move stocks. Also bear in mind that January's personal spending and personal income reports will be posted on Friday, adding some perspective to the sentiment and retail spending picture.
Stock Market Index Analysis
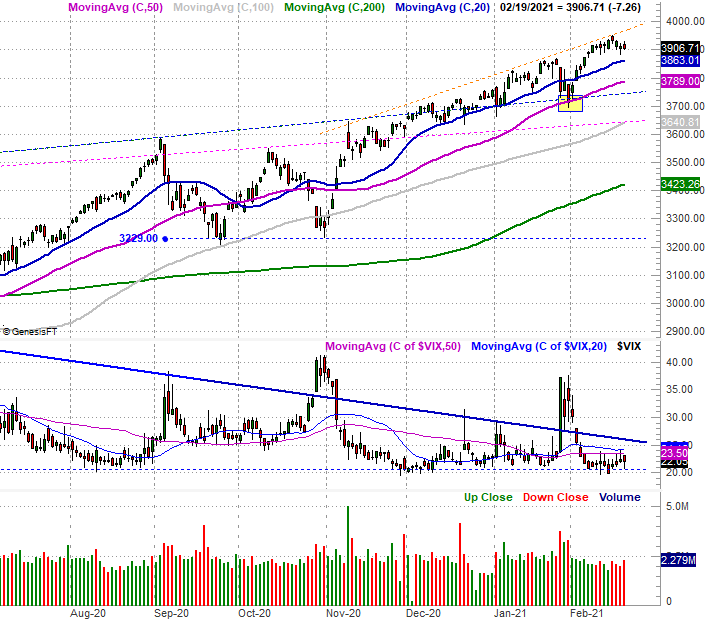
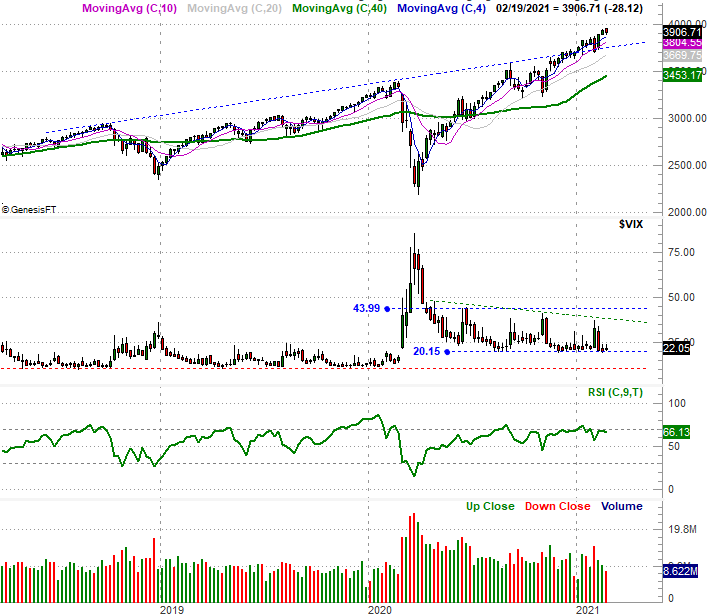
Stocks may have lost a little ground last week, but put things in perspective. The S&P 500 was up nearly 7% in less than two weeks as of mid-day on Tuesday, and is still up by 78% since last March's low. The index also bumped into a recently-established technical ceiling (orange, dashed) with Tuesday's surge, and was due a break. It simply took a small one. The advance is hardly broken yet.
Moreover, the VIX held its ground; not moving much higher or lower last week, even including in expiration Friday. One would have thought we'd at least see some movement there -- as traders piled in and out of option positions -- but we clearly didn't. The fact that the VIX didn't suddenly surge higher at this first hint of trouble suggests traders aren't getting nervous just yet, which is bullish -- in a sense.
S&P 500 Daily Chart, with VIX and Volume
Source: TradeNavigator
In fact, in looking at the weekly chart of the S&P 500, it almost seems the VIX's bigger trend is still pointed downward, with the volatility index on the verge of breaking below its horizontal support around 20.0. This weekly chart also illustrates the scope of the runup since March's low. Even though much of it was born of the rebound from March's steep selloff, the last bit of the bullishness has carried the market well above its long-term guideposts.
S&P 500 Weekly Chart, with VIX, RSI, and Volume
Source: TradeNavigator
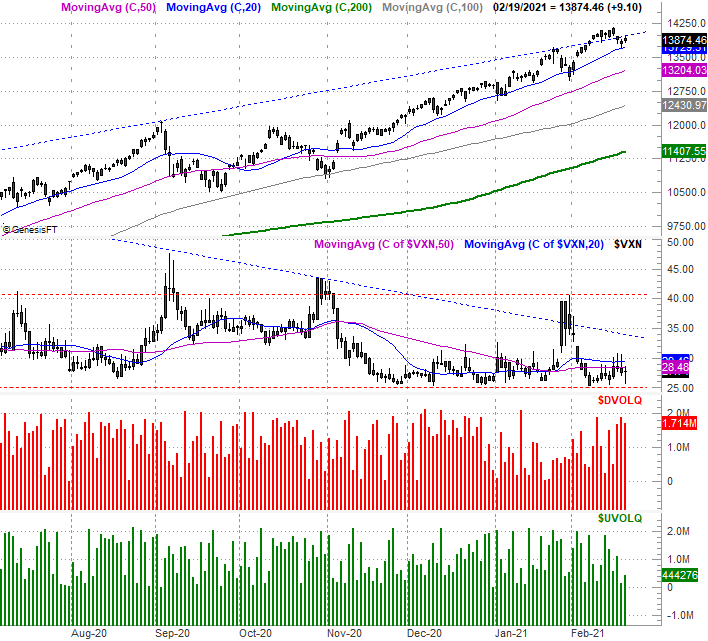
Ditto for the NASDAQ Composite's weekly chart. It's well overextended, and despite every reason to, its volatility index -- the VXN -- didn't budge last week. In fact, like the VIX, the VXN looks like it's on the verge of lower lows. It just needs to break its technical support at 24.9.
NASDAQ Weekly Chart, with VXN and RSI
Source: TradeNavigator
A closer look at the NASDAQ with its daily chart, however, shows us something very curious. That is, while the composite has continued to move forward this month, the amount of bullish volume has been shrinking. The amount of bearish volume has been growing. The undertow is more bearish than bullish, even if things don't look that way on the surface.
NASDAQ Daily Chart, with VXN, Bullish Volume and Bearish Volume

Source: TradeNavigator
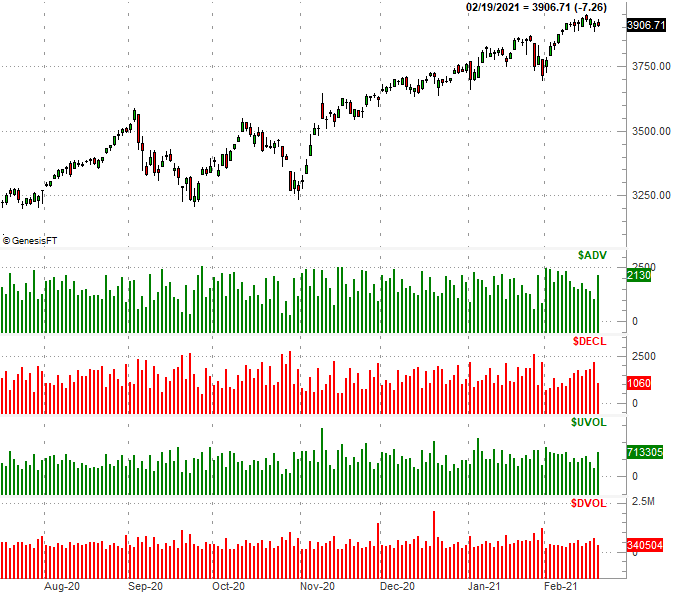
This is also generally true of the NYSE's volume, with the exception of Friday, wherein we saw decidedly more bullish volume than bearish volume and decidedly more gainers (ADV) than decliners (DECL). Aside from this one day, however (probably attributable to option expirations), the NYSE's bullish volume and number of advancing stocks has been waning for three weeks now, while bearish volume and the number of stocks logging daily losses has been on the rise.
S&P 500 Daily Chart, with Bullish and Bearish Volume, Advancing and Declining Stocks
Source: TradeNavigator
As was already noted, the uptrend is still intact. There's even room for a little more selling without snapping the marketwide rally; the short-term moving average lines (the 20-day moving average line for the NASDAQ in particular). The volatility indices are also still suppressed.
All of these things must change before there's a real bearish trade to be made. Still, the changing volume dynamic and shift in market breadth is turning into a more meaningful red flag.


