
Weekly Market Outlook – As Bad As Last Week Was, It Still Wasn’t A Death Blow
It was the second sizable weekly setback in a row for the market. But, it's still not like the selling has raced out of control. Indeed, the shape and scope of last week's bars at least opens the door to the possibility of a bounce this week.
That's not a prediction, to be clear. It's just a possibility rooted in the way the buyers were stepping back up to the plate again late Friday to offset at least some of that day's loss. Traders could have just as easily decided to dump their positions headed into the weekend. They just chose to use the pullback as a chance to scoop up some beaten-down names. Mostly matters are still on the fence (yet even more selling this week wouldn't necessarily break the market's back).
We'll dissect the mixed message below, as we always do. First, though, let's review last week's biggest economics new -- like November's jobs report -- and then preview the announcements coming this week.
Economic Data Analysis
Last week's biggie was, of course, the jobs data. But, first things first. The party started with a look at last month's consumer confidence figure from the Conference Board, followed by the third and final report of consumer sentiment from the University of Michigan. Both fell, with the latter slumping to the lowest levels since 2011. Clearly people are at least a little concerned about the lethargic rebound.
Consumer Sentiment Charts
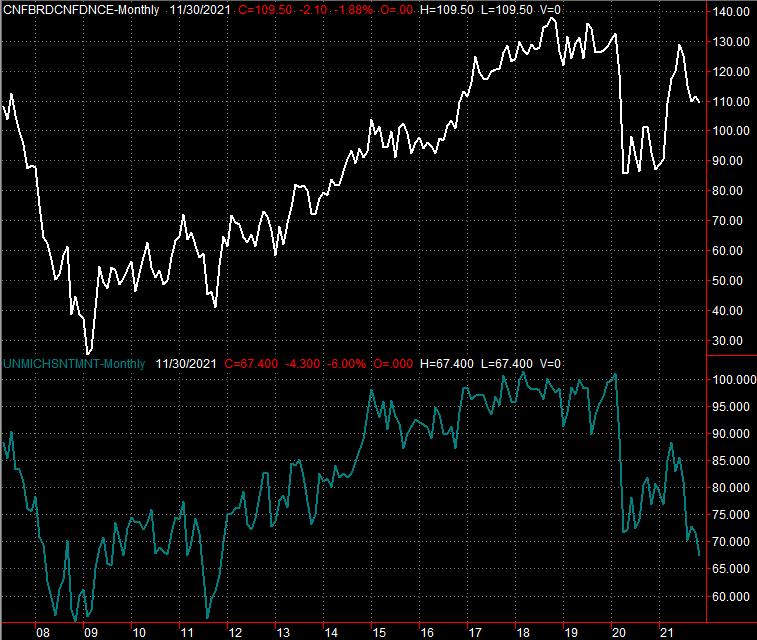
Source: Conference Board, University of Michigan, TradeStation
Home prices, nevertheless, continue to charge higher.
The spin on last month's update of the S&P case-Shiller Index was negative, highlighting the fact that the pace of progress has slowed from recent rates. And, it has. Keep it in perspective, though. Those comparisons are sky-high, and value growth is still soaring. Home prices grew 19.1% year-over-year in September; the FHFA's measure of home prices tells a similar story.
Home Price Charts
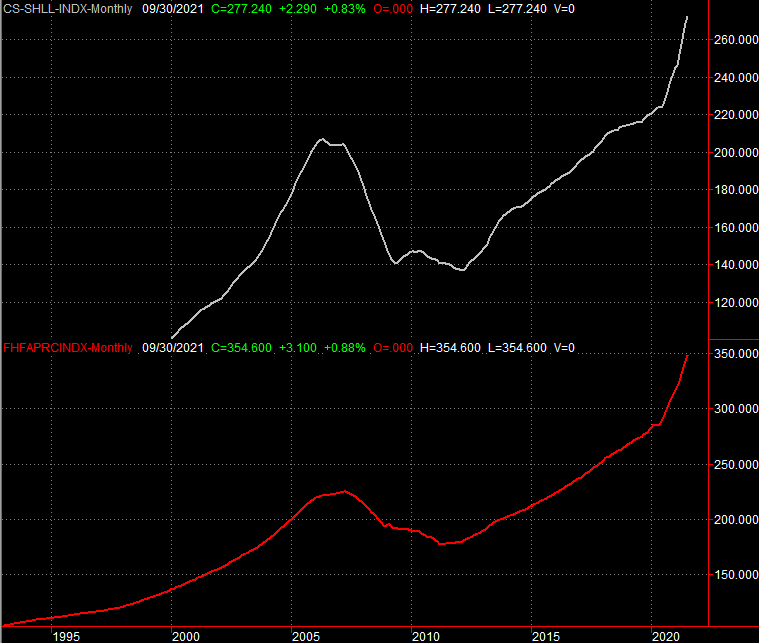
Source: Standard & Poor's, FHFA, TradeStation
Still, two things to note: (1) Both sets of home price data are two months behind current conditions, and much could have changed in the meantime. (2) The soaring pace of home price growth is going to slow down sometime sooner rather than later. Brace for it, but also bear in mind that this won't necessarily signal a meltdown of the real estate market.
We also got both of the Institute of Supply Management's big reports last week. The manufacturing measure ticked a little higher, and better still, the services index defied expectations for a small dip by climbing from October's 66.7 to a record high of 69.1.
ISM Manufacturing and Services Index Charts
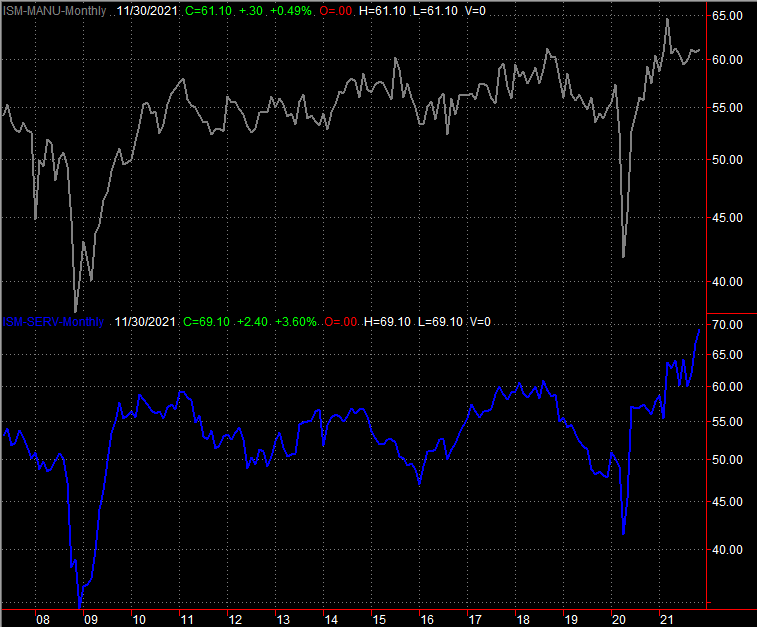
Source: Institute of Supply Management, TradeStation
This is clearly bullish for stocks.
What's not bullish for stocks is Friday's look at last month's job numbers. The unemployment rate fell from 4.6% to a pandemic low of 4.2%, but payroll growth of only 210,000 for November fell well short of the expected 525,000. The unemployment rate only managed to log such a dramatic drop because the number of people officially categorized as being unemployed dropped by 542,000.
Unemployment Rate and Payroll Growth Charts
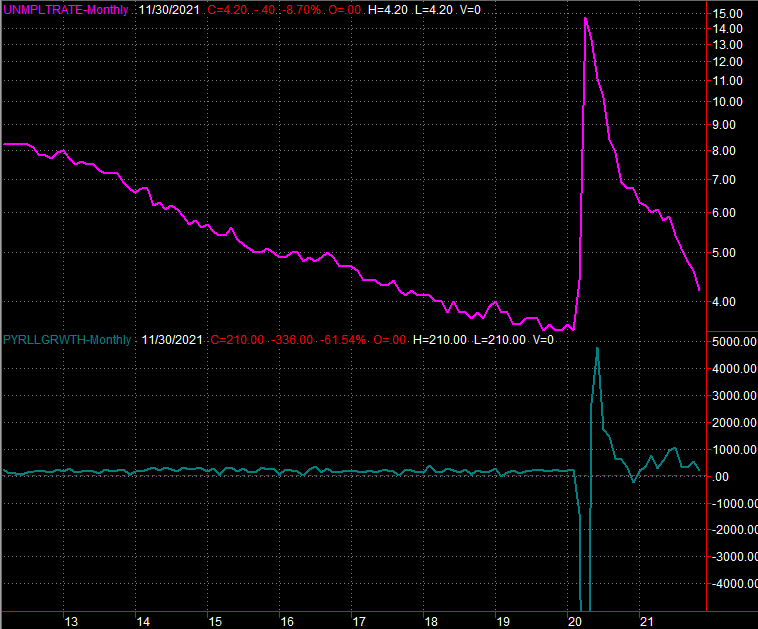
Source: Department of Labor, TradeStation
Everything else is on the grid.
Economic Calendar
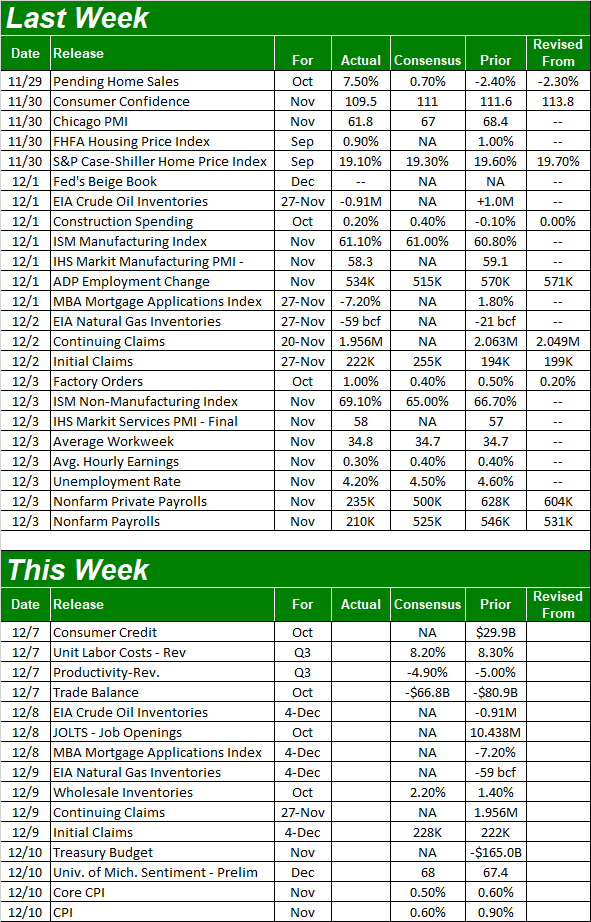
Source: Briefing.com
There's not a lot in the lineup for this week, although we will start fleshing out the inflation picture through November with a look at the consumer inflation rate on Friday. It's expected to cool just a bit from October's brisk pace. With the annualized inflation rate standing at 6.2%, a slight cooling isn't going to be much meaningful relief. That's going to keep pressure on the FOMC to do something about soaring prices sooner than it may have been planning on.
Inflation Rate Charts
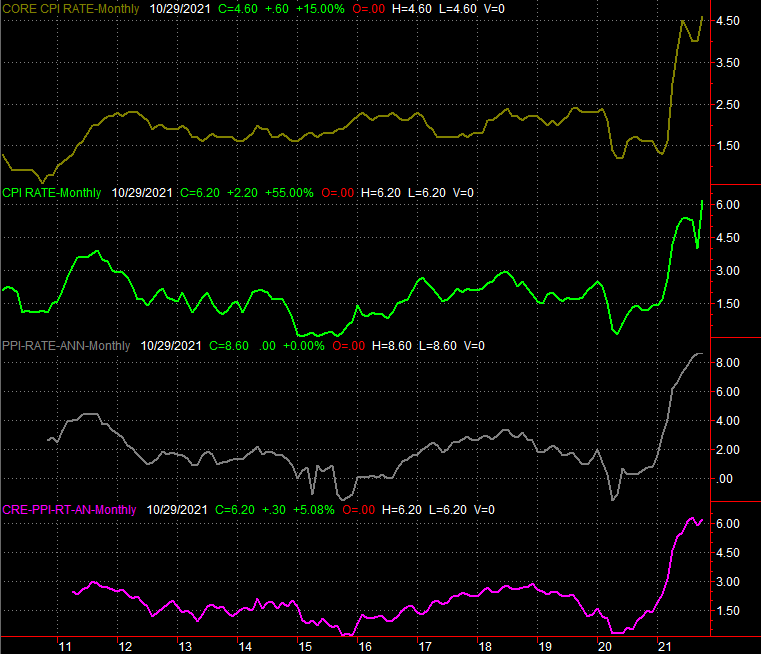
Source: Bureau of Labor Statistics, TradeStation
The producer inflation report for November will be posted next week.
Stock Market Index Analysis
It could have been worse last week, and for a brief while, it was. Most of the major market indices slipped below their 50-day moving averages in the middle of last week, and though most of them managed to move back above that line thanks to Friday's late rebound effort, the pullback is still a concern.
See, while we've survived similar setbacks before only to end up making higher highs, this instance is a bit different than those other times. This time, the market's volatility indices are clearly making higher highs.
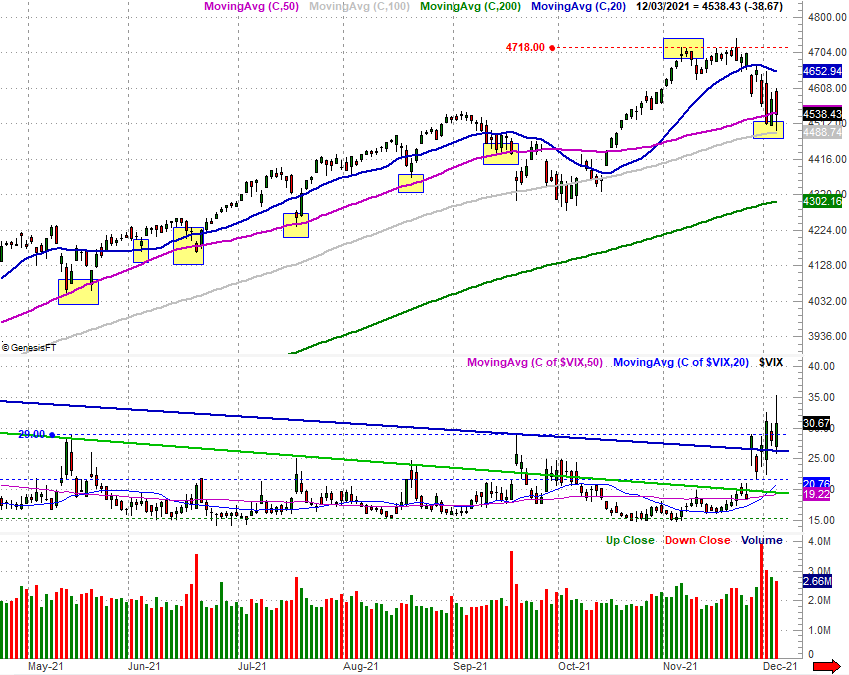
Take a look at the S&P 500 and its volatility index -- the VIX -- below. The S&P 500 itself is dancing with support at its 50-day (purple) and 100-day (gray) moving average lines, but the VIX is firmly moving above key technical ceilings for the first time in months.
Something's clearly changing, if nowhere else but in investors' minds. They're posturing more defensively, hence the rising VIX. This mindset may well mean they've already pre-planned a pullback, even if they didn't push stocks over the edge last week.
S&P 500 Daily Chart, with VIX and Volume
Source: TradeNavigator
The same story applies to the Nasdaq Composites and its volatility index. That is, the Nasdaq was sent firmly lower again last week, but that pullback came to a halt once the index found itself entangled with its 50-day (purple) and 100-day (gray) moving average lines.
Nevertheless, the Nasdaq Volatility Index (VXN) broke above a technical resistance line around 29.0; the VXN pushed above a long-term technical ceiling (green) late last month. This is the first time in months we've seen the Nasdaq's volatility index above either line, again suggesting a major change in how traders are thinking.
Nasdaq Composite Daily Chart, with VXN
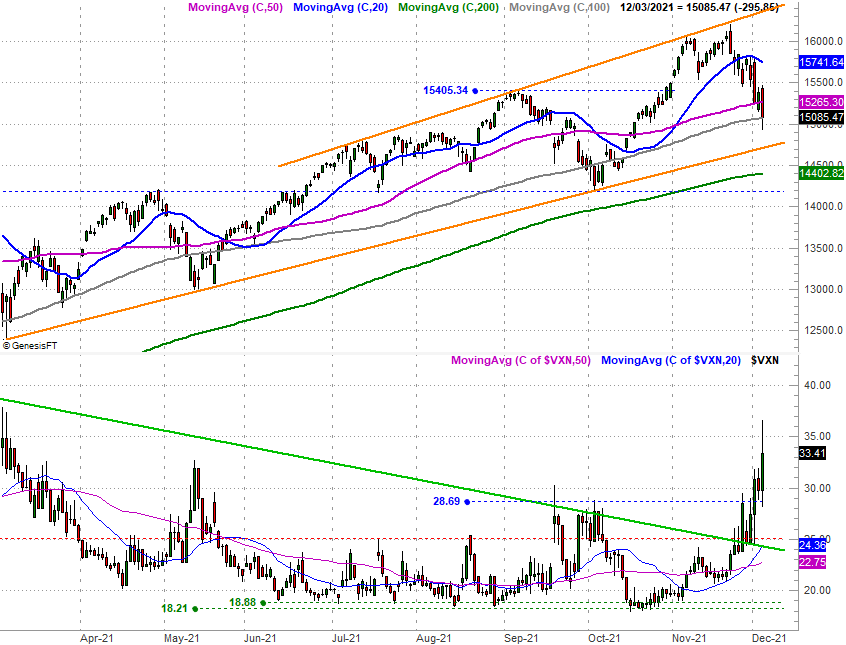
Source: TradeNavigator
There's something else that's noteworthy of the Nasdaq's daily chart, although it's better viewed on the weekly chart. That's the composite's trading range - framed in orange - that's framed the index's action beginning early this year. Even with the 7% setback from the all-time high hit a couple of weeks back, the Nasdaq is still within those bullish confines. The weekly chart also puts the VXN's recent rally in perspective,
Nasdaq Composite Weekly Chart, with VXN
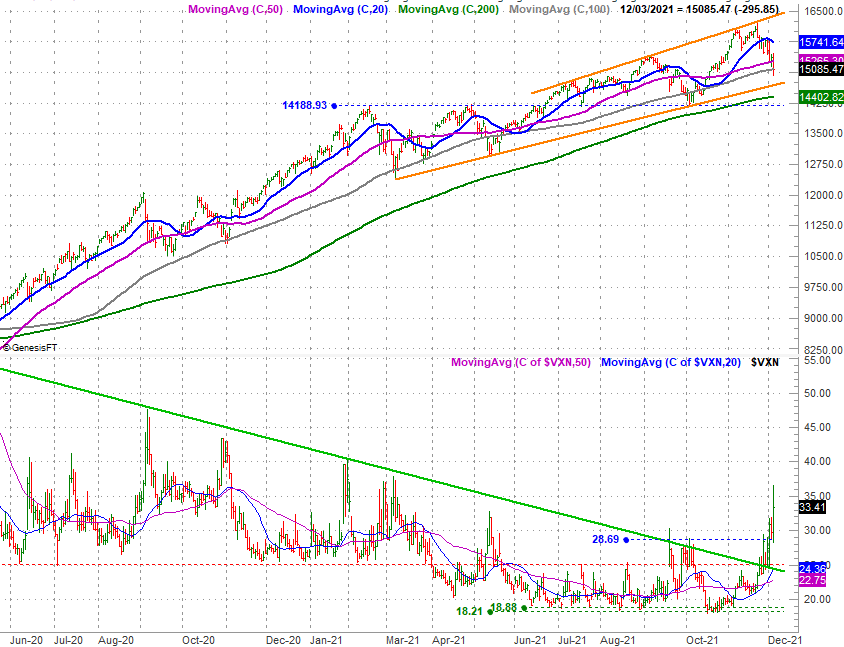
Source: TradeNavigator
And it's not just the Nasdaq that's on the verge of serious trouble either. As we pointed out last week at the website, the Dow Jones Industrial Average is close to breaking under its 200-day moving average line (green) for the first time since early last year.
Dow Jones Industrial Average Daily Chart
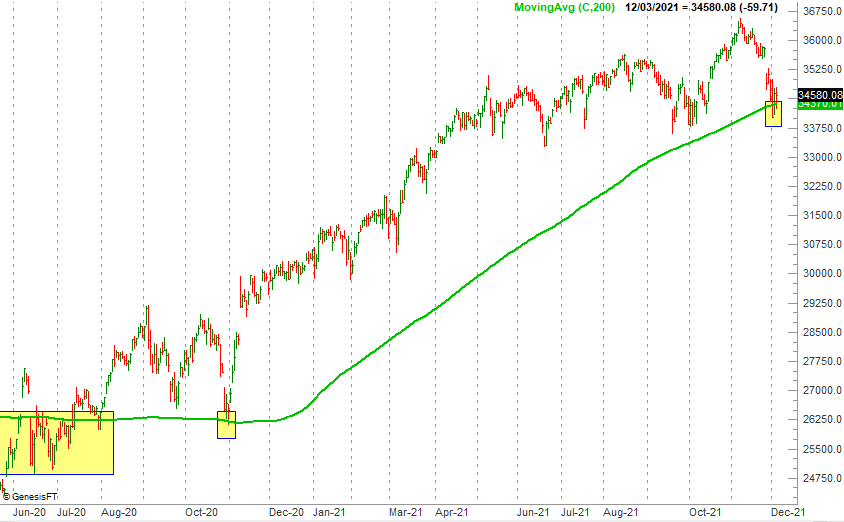
Source: TradeNavigator
The Russell 2000 small-cap index is testing a major floor of its own. The technical floor that connects all the key lows made since February is now being tested again, and is one bad day away from moving under that support level.
Russell 200 Daily Chart, with Volume
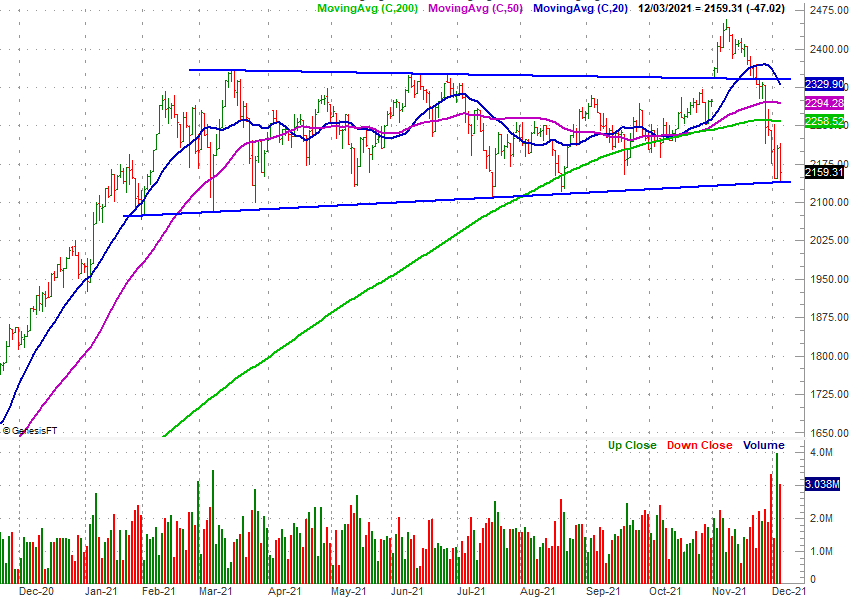
Source: TradeNavigator
With all of that being said, perhaps it's the weekly chart of the S&P 500 that's most worth watching here, as this is where the broad market's meltdown will most clearly begin if-and-when a pullback does start to materialize -- if that's what's in the cards.
And these red flags will be easy to identify. The S&P 500 has formed a clear trading range of its own since the latter half of last year (framed in pink), and as of the end of last week is within striking distance of that floor; the 200-day moving average line (green) isn't too far below that.
The weekly chart of the S&P 500 also shows us how much the volatility index has changed direction in just the past couple of weeks. If it firms up this advance - just by virtue of holding above 29.0 - or even pushes its way above 38.0 (give or take), that's apt to be a sign that the flood gates have opened and can't be closed again until all the water drains.
S&P 500 Weekly Chart, with VIX and Volume
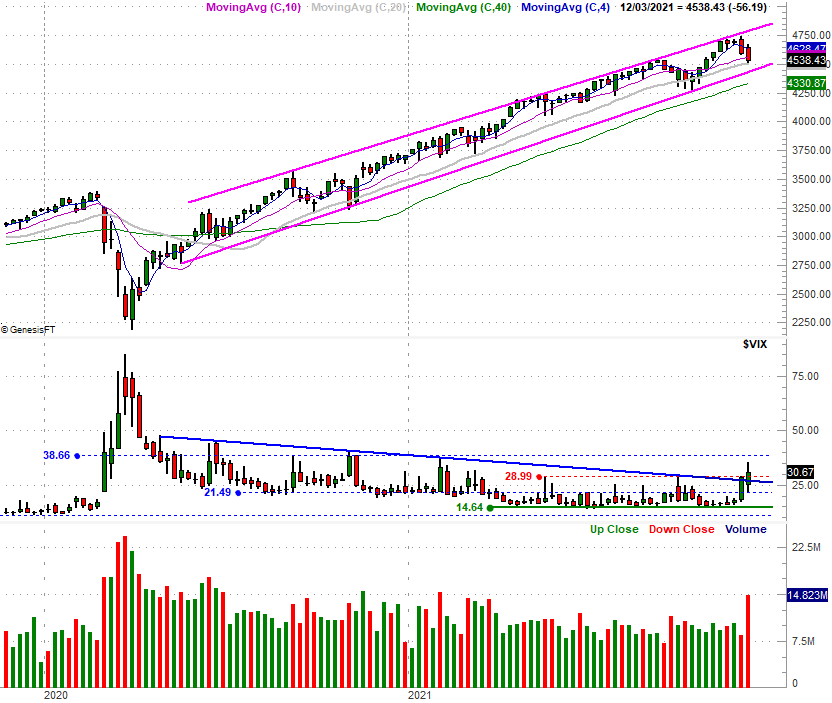
Source: TradeNavigator
The thing is, nobody can afford to think preemptively or predictably here. There's a ton of technical support still propping the market up, and we're in a very bullish time of year that can easily defy the current situation's odds of a selloff. The trend is still the trend until it clearly isn't.


