
Weekly Commitment Of Traders Analysis
Following futures positions of non-commercials are as of November 19, 2019.
10-year note: Currently net short 183.5k, up 34.7k.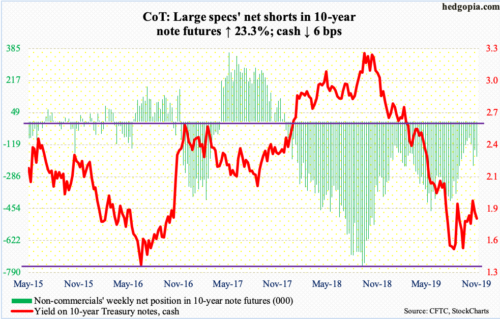
Interesting dynamics are in play in the sovereign bond market.
In the 12-months to October, US budget deficit crossed $1 trillion. This at a time when the economy is in its 11th year of recovery/expansion post-Great Recession! Not surprisingly, the pace of federal borrowing has picked up speed, with net issuance of $934 billion in Treasury notes and bonds in the 12 months to October. Historically, the two move hand in hand. As do Treasury issuance and foreigners’ buying/selling, except of late the two have diverged. In the 12 months to September, foreigners net-sold $171 billion in notes and bonds (more on this here). Foreigners have been net sellers since January this year. They hold $6.8 trillion in Treasury securities. Hence the need to closely watch the current trend.
Arguably, less foreign buying is being offset by more buying by the Fed. In the last couple of months, the bank’s SOMA (System Open Market Account) holdings went from $3.55 trillion to $3.63 trillion, with Treasury bills going from a negligible amount to $84 billion. Mid-September, the Fed began to inject liquidity through repo operations due to stress in money markets.
The 10-year T-yield (1.77 percent) is worth watching in this regard. After peaking in October last year at 3.25 percent, it fell all the way to 1.43 percent early September this year. Yields then rallied to just under two percent before coming under pressure. There is important trend-line support at 1.63 percent, which likely does not break should the majority believe foreigners will continue to reduce exposure to US sovereign.
30-year bond: Currently net short 47.7k, up 2.3k.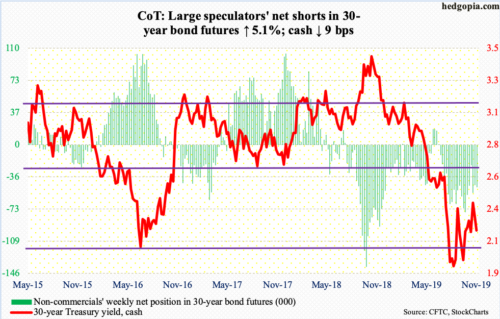
Major economic releases next week are as follows. Happy Thanksgiving!
Tuesday, the S&P Case-Shiller home price index (September) and new home sales (October) are due out.
Nationally, US home prices rose at a 3.17 percent annual rate in August, up from 3.14 percent in July. This was the first monthly rise after 16 drops in a row. In March last year, prices were rising at a 6.49 percent pace.
Sales of new homes edged lower 0.7 percent month-over-month in September to a seasonally adjusted annual rate of 701,000 units. The cycle high 729,000 was reached in June.
Wednesday brings GDP (3Q19, 2nd estimate), corporate profits (3Q19, preliminary), durable goods orders (October) and personal income (October).
The first estimate showed real GDP grew 1.9 percent in 3Q, down from two percent in 2Q and 3.1 percent in 1Q.
Corporate profits with inventory valuation and capital consumption adjustments in 2Q19 rose 1.3 percent over the corresponding quarter of last year to $2.08 trillion (SAAR). Profits are yet to surpass the record $2.19 trillion reached in 3Q14.
In the 12 months to September, orders for non-defense capital goods ex-aircraft – proxy for business capex plans – dropped 0.8 percent to $68.6 billion (SAAR). The all-time high $70 billion was reached in July last year.
In September, core PCE – the Fed’s favorite measure of consumer inflation – rose 1.67 percent. The last time inflation rose with a two handle was in September last year. The Fed has a two percent goal.
WTI crude oil: Currently net long 607.8k, up 11.9k.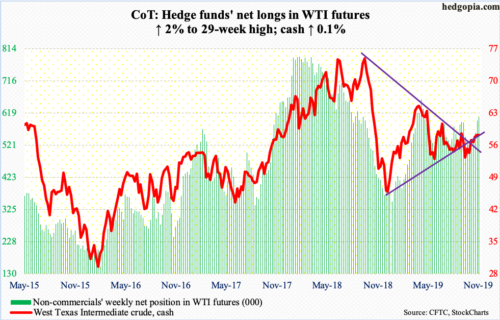
Early October, bulls defended support at $50-51 on the cash ($57.77/barrel). A rising trend line from that low was defended Wednesday, with the session low $54.85 also approximating the daily lower Bollinger band; $54-55 also contains horizontal support. By Thursday, the crude tagged $58.67 intraday, just past the upper end of the band. The two-day spike helped bulls recapture both the 50- and 200-day moving averages. For three weeks now, the latter ($57.44) in particular was proving to be a stumbling block; that said, bulls were already forced to test the average on Friday.
Wednesday’s reversal came amidst a slight buildup in US crude stocks, which rose 1.4 million barrels to 450.4 million barrels. The EIA report for the week of November 15, out Wednesday, also showed gasoline stocks rose as well, up 1.8 million barrels to 220.9 million barrels. As did crude imports, up 222,000 barrels per day to 6 mbpd. Crude production remained unchanged at 12.8 mbpd, a record. Distillate stocks fell 974,000 barrels to 115.7 million barrels. Refinery utilization increased 1.7 percentage points to 89.5 percent.
E-mini S&P 500: Currently net short 8.4k, up 18.4k.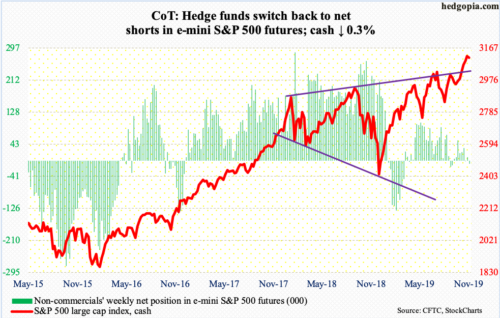
Bears finally had some opening this week. Tuesday, the cash (3110.29) notched a new all-time high of 3127.64, before coming under slight pressure. In all of the latter three sessions, bulls stepped up to defend short-term support at 3100. This also approximated the 10-day, which has not been lost in the past six weeks. The average – now flattish – needs to roll over and pierce through the 20-day for bears to get traction. Conditions remain grossly overbought. The daily RSI, which closed out the week at 66.9, peaked just under 76 early in the week.
Flows were not in cooperation. The breakout from 3020s four weeks ago is yet to meaningfully attract flows. In the week to Wednesday, SPY (SPDR S&P 500 ETF), VOO (Vanguard S&P 500 ETF) and IVV (iShares Core S&P 500 ETF) lost a combined $1.8 billion (courtesy of ETF.com). In the same week, US-based equity funds lost $2.8 billion (courtesy of Lipper).
Euro: Currently net short 62.5k, up 4.8k.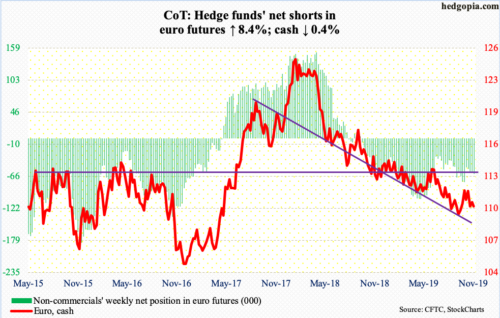
Until Thursday, the cash ($110.15) pretty much went sideways above the 50-day ($110.42). Friday changed that, with the euro slicing through the average. Rally attempts got denied at horizontal resistance at $111. Should weakness develop near term, which is likely, there is trend-line support at $110.10 from early October. The currency bottomed at $109.85 back then.
Gold: Currently net long 285.9k, up 18.8k.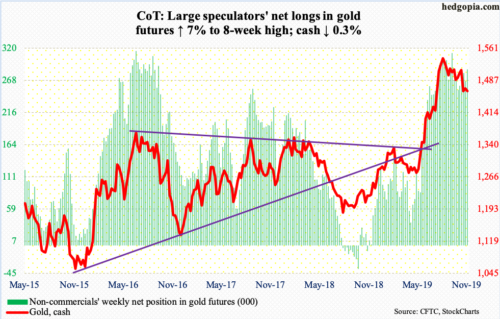
The cash ($1,463.60/ounce) reclaimed the 10-day ($1,466.36) early in the week, but only to face resistance at the 20-day. Nine sessions ago, gold dropped intraday to $1,446.20 for a successful retest of $1,440s-50s, which the metal broke out of early August. The daily lower Bollinger band lies at $1,442.62. Near term, gold could very well test this support zone, particularly if the prevailing flows trend continues.
In the week to Wednesday, IAU (iShares Gold Trust) and GLD (SPDR Gold ETF) respectively lost $33 million and $235 million (courtesy of ETF.com).
Nasdaq 100 index (mini): Currently net long 34.6k, down 5.3k.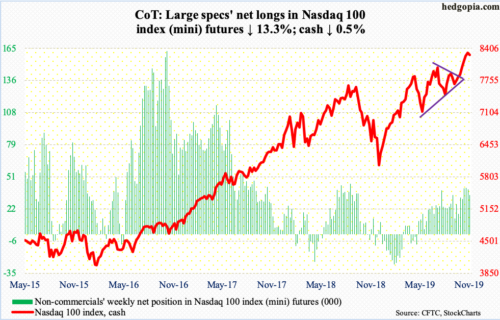
After seven consecutive positive weeks, the cash (8272.05) dropped 0.5 percent this week. In the week to Wednesday, $410 million came out of QQQ (Invesco QQQ Trust). This followed inflows of $3.3 billion in the prior three (courtesy of ETF.com).
On the daily, a potentially bearish MACD cross-under formed this week. Conditions overall are overbought enough unwinding can begin any time. Bears have an opportunity here. The steep trend line from October 3 when the Nasdaq 100 bottomed at 7463.57 was broken this week. The index witnessed an important breakout a month ago. Retest takes place just north of 8000.
Russell 2000 mini-index: Currently net short 3.8k, down 3.6k.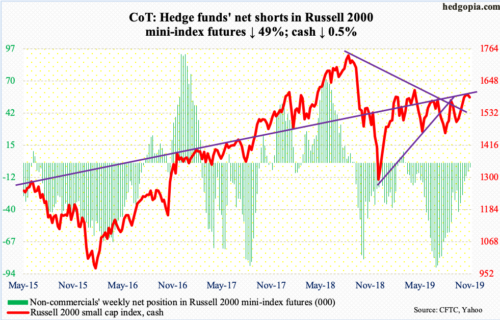
Bullish momentum is waning on the cash (1588.94). In the past three weeks, small-cap bulls hammered on 1600-plus several times, including twice this week, but only to see selling orders accelerate. This crucial resistance goes back to January last year. Shorter-term averages are on the verge of rolling over. Bears likely get more active once that happens. Incidentally, a 50/200 golden cross formed on the Russell 2000 two weeks ago. But not much came out of it. The 50-day (1552.93) is now flat. The 200-day (1545.83) is right underneath.
The inability of small-cap indices to break out to new highs coincides with a persistent drop in FINRA margin debt since peaking in May last year at $668.9 billion. In October, it dropped $1.3 billion m/m to $554.6 billion.
Amidst this, in the week to Wednesday, $380 million was redeemed from IWM (iShares Russell 2000 ETF), while IJR (iShares Core S&P Small-Cap ETF) pulled in $48 million (courtesy of ETF.com).
US Dollar Index: Currently net long 24.6k, down 3.2k.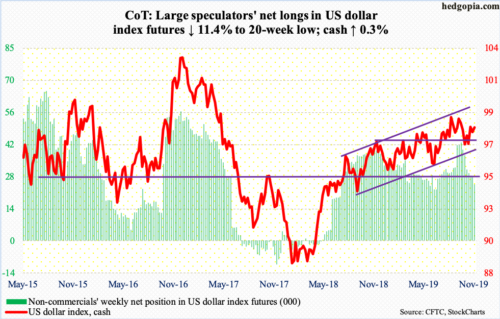
Dollar bulls put their foot down at 97.50s this week. This preceded a slight drop since the cash (98.18) tagged 98.30 eight sessions ago. Friday’s 0.3-percent rally past the 50-day also took care of a falling trend line from early October. The daily has room to push higher near term.
VIX: Currently net short 218.4k, up 12.2k.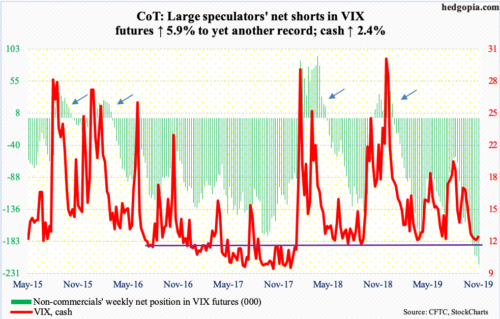
Support at 12 was tested. A break would have likely opened the door to a test of 10-11. The cash (12.34) has not broken 10 since January last year. At the same time, in four of the five sessions, volatility bulls were not able to hang on to the intraday gains. A potentially bullish 10/20 crossover is close, but by Friday VIX again closed below both averages. Amidst all this, daily Bollinger bands have narrowed to a point only 1.44 points separate the two. A sharp move is imminent. And non-commercials took their net shorts in VIX futures to yet another record.
In the meantime, equity bulls are so complacent the 21-day moving average of the CBOE equity-only put-to-call ratio closed out the week at 0.572. This was the lowest since July last year. Buying protection is cheap. Historically, the ratio tends to bottom at high 0.50s to low 0.60s. Once unwinding of this euphoria begins, bulls pull in their horns.


