Weekend Charts – Extreme Readings
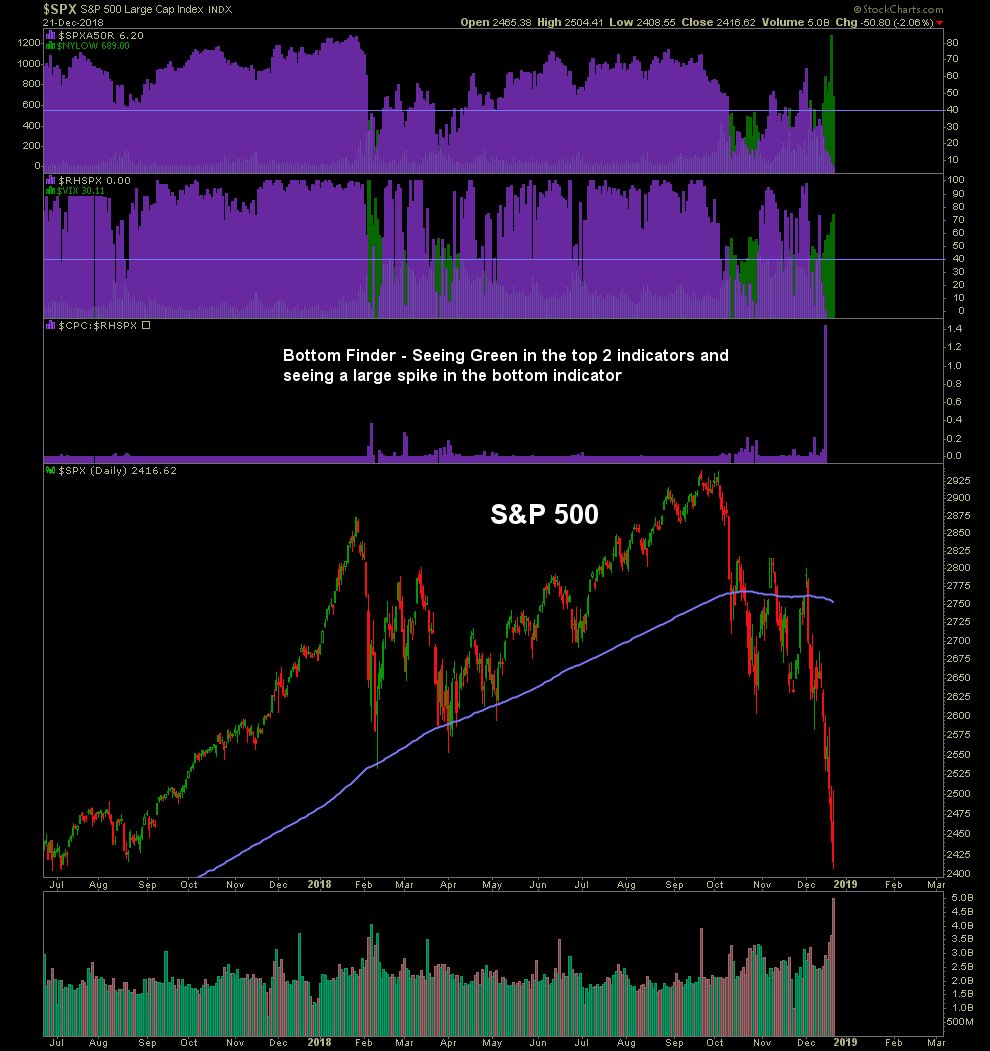
Bottom Finder – Not a timing chart – but generally gives you a heads up. Head is up, for sure. Down volume is HUGE. Sellers selling at the lows. That’s called giving up, right?
(Click on image to enlarge)
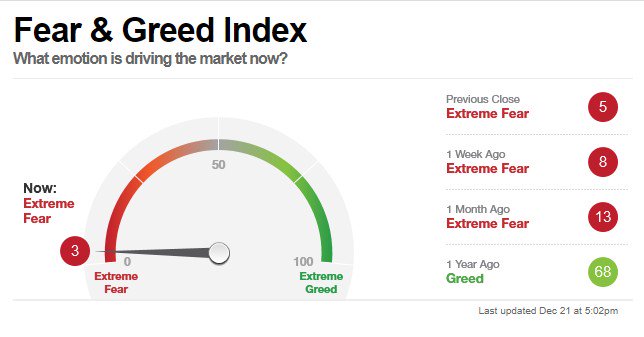
CNN Money Fear & Greed Index is at a “3” – EXTREME FEAR. Has anyone ever seen this more oversold? Markets may be oversold short term. However, FAR AWAY from EXTREME FEAR!
Remember October 2008? VIX @ 90. That's more like extreme…
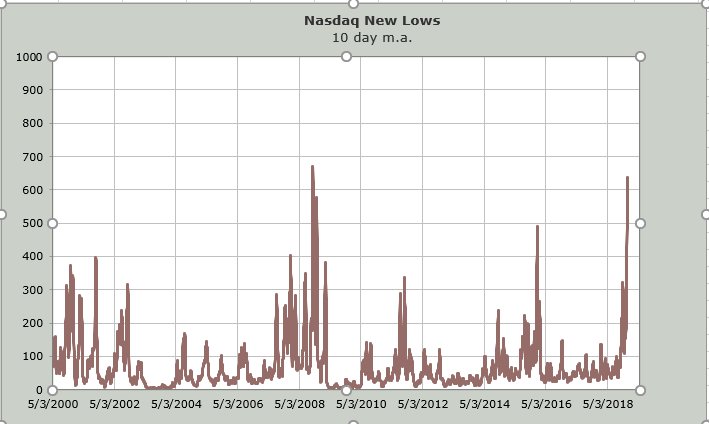
10DMA of Nasdaq new lows. Closing in on Oct. 2008 level.
2008: 670
now: 630
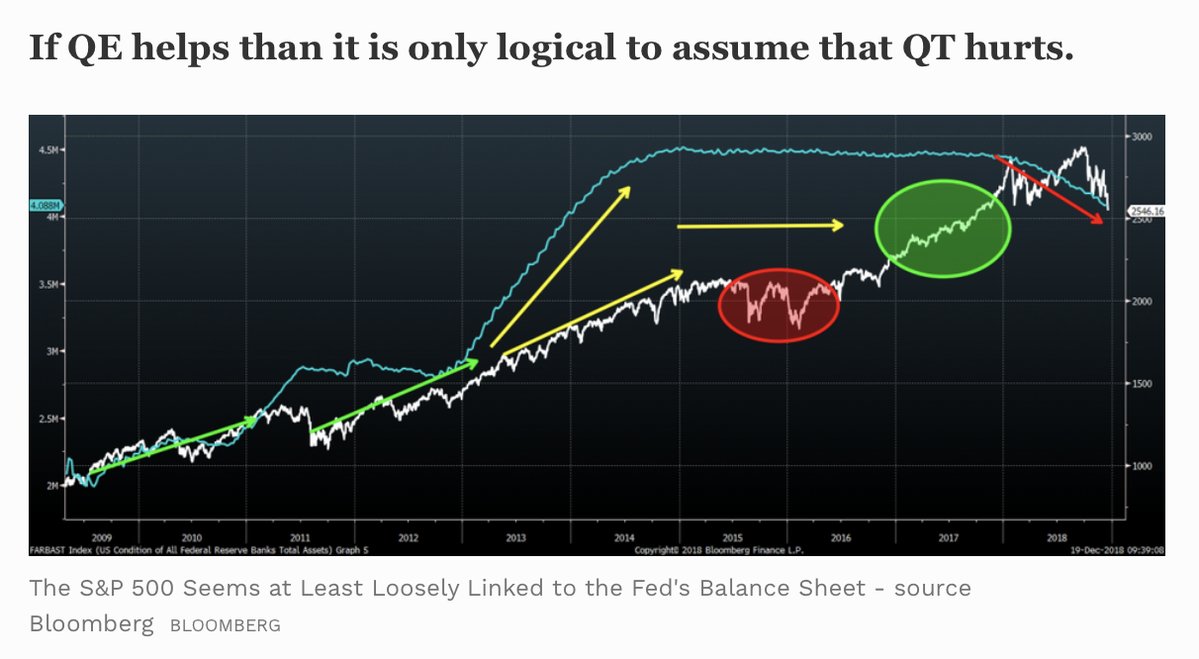
While everyone wants to discuss interest rates, the impact of balance sheet reduction may be more important than hikes and if that isn’t addressed, expect more volatility and stock market problems.’
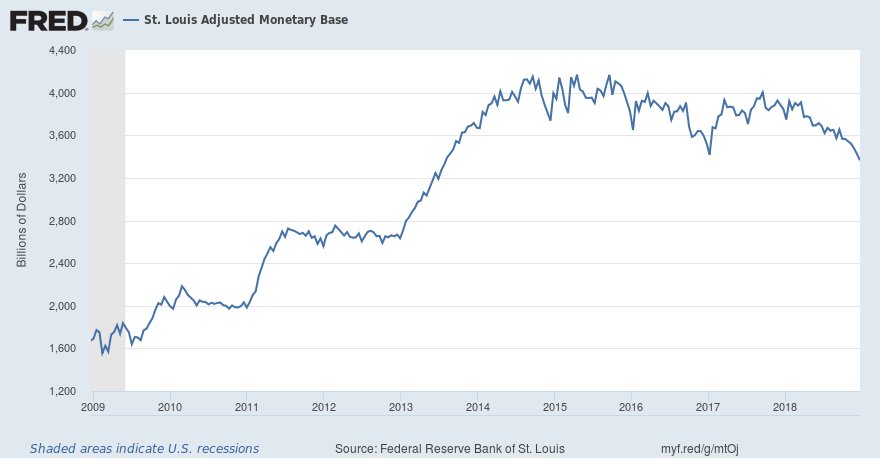
Adjusted monetary base drops by $57 billion over two weeks to $3.365 trillion, the lowest level since July 2013
(Click on image to enlarge)
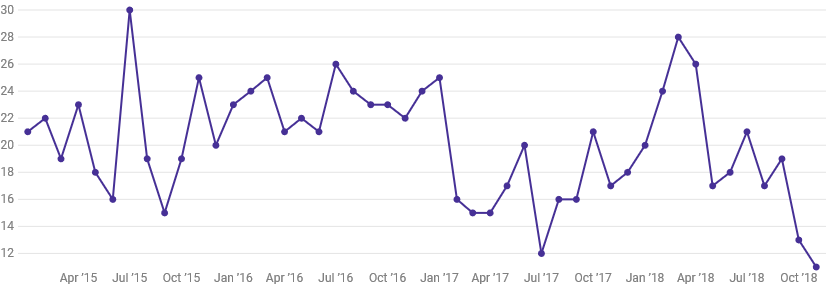
The number of passengers flying in domestic airlines fell to its lowest in at least four years in November due to a rise in airfares in the world’s fastest-growing aviation market.
(Click on image to enlarge)