
Weakness In Corporate Revenue Is A Bad Sign For 'Buy-N-Hold' Investors
There is one thing that has always nagged me during the 2nd longest bull market run in U.S. history. Corporations have roughly the same revenue per share today as they did halfway through 2007. And yet, sales growth per stock share has only recovered to the pre-crisis levels of 2007, whereas the S&P 500’s price has vaulted 40% up and above the pre-crisis levels of 2007.
While it is true that bottom-line corporate profits have increased handsomely, most recognize that this is a direct function of balance sheet manipulation. When a company purchases back its own shares, it reduces the shares in existence, causing earnings per share to increase. Yet the corporation has not actually increased its profitability; it did not earn any more money, though it did fool the world into thinking it generated more earnings.
Top-line revenue, or sales, is the lifeblood of a viable business going forward. Who is expressing concern about the market’s P/S of 1.8 in 2015 versus a P/S ratio of 1.5 at the onset of the credit collapse?
Consider the following data. Over the last 60 years, the median P/S ratio has been approximately 1.0. With the exceptions of "New Economy" euphoria in the late 1990s – with the exception of the bull market peaks of 1998 and 2000 – the current P/S of 1.8 is the highest price-per-sales ratio in 60 years of data keeping. Is it genuinely reasonable to acquire stocks at a 17% premium above the credit crisis top of 2007 or to acquire shares at a 44% premium above the 60-year average price-to-sales ratio? Just because interest rates are so low?
Don’t get me wrong. My client portfolios have a significant allocation to U.S. stocks, from Vanguard Mid-Cap Value (VOE) to iShares S&P 100 (OEF) to iShares USA Minimum Volatility (USMV) to SPDR Select Health Care (XLV). I am reluctantly bullish, and will remain so until positions break below and stay below long-term moving averages. For instance, a substantive breach of a key trendline for OEF – closing below and staying below a 200-day – has not occurred in over three years.

Perhaps ironically, the longer a rally continues unabated, the more that people gain confidence in "hold-n-hope." Investors even become more aggressive with their allocation to stock. Pundits routinely downplay risk of losing capital; they attach little importance to volatile price swings. Meanwhile, the Wall Street marketing machine dismisses the successful investing notion of selling high and buying low. Just buy it, hold it and forget it. With your money invested somewhere other than cash, commission-based brokers and mutual fund managers generate more wealth for themselves.
You do not need a broker or a planner who tells you that he will allocate your assets according to your risk tolerance and leave it there. You can do that yourself. For example, a 50-year old who plans to retire at 65 and wishes to to hold-n-hope until retirement might consider a variation of the following “hold-n-hope” ETF portfolio:
A Typical Recommendation For A 50-Year Old "Hold-N-Hope" Investor
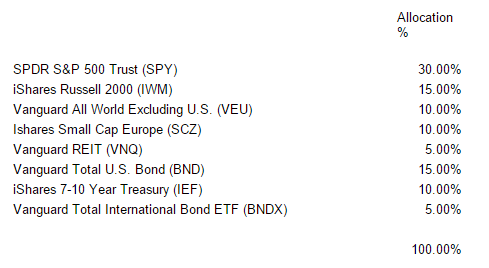
Unfortunately, this portfolio lost 36% of its value in an 18-month stretch (10/9/2007-3/9/2009). How many hold-n-hopers at retirement will still be as bold to do so when the $750,000 they believed they had has dwindled to $480,000? How comfortable will they be taking more stock risk, as they pray for central bank intervention through a fourth and fifth and sixth iteration of quantitative easing (QE)? More importantly, what if the current central bank distortions cause bond and stocks to collapse together, as opposed to the safe haven nature of bonds in the past? Yes, $750,000 might easily erode to $325,000.
There are plenty of methods for minimizing a catastrophe. Put option protection, "long" volatility funds, increasing cash levels at new 52-week highs, "short" ETFs, multi-asset stock hedging, trendline analysis,stop-limit loss orders – you might even diversify your methodology. Regardless, it is imperative to apply insurance principles to the investing process.
Another idea? Invest in ETF assets with considerably lower P/S ratios. According to data at Morningstar as well as Wisdom Tree, the WisdomTree Small Cap International Dividend Fund (DLS) has a P/S of roughly 0.62. It may be worth waiting to buy a proverbial dip after an impressive year-to-date run. Nevertheless, both the revenue growth data and the rate cutting activity by central banks internationally bode well for DLS.

ETF Expert is a web log (”blog”) that makes the world of ETFs easier to understand. Gary Gordon, MS, CFP is the president of Pacific Park Financial, Inc., a Registered Investment Adviser ...
more

