
We Are Not In A Bubble
1929, 1987, 2000, 2008, 2020!
As you might have guessed already, the dates indicate the years in which the world experienced global financial crises. To be precise, in these years the stock markets were in crisis. However, we generally reject the term ‘crisis’, but rather see them as inevitable and necessary corrections – or as the ideal moments to buy and hold stocks for a lifetime.
Let us just take a look at the media coverage of the Corona-Crisis. Instead of reporting the numbers of healed patients, numbers of newly infected people are constantly in the focus of the media, although these recovering patients are greatly outnumbering the people falling ill due to COVID-19. Whether these people were ill in the first place remains another secret. What is clear, however, is that fear is a much stronger emotion than greed.
Greed and fear are the two determining factors of the capital markets. Our analytical premise is to calculate the interplay between optimism (or greed) and pessimism (or fear), which works really well-using Fibonacci-numbers. With this objective and purely mathematical approach, it is possible to contain the emotions of greed and fear and has the chance to make rational and sound investment decisions.
However, many avoid just that, since fear is a great tactical tool, which is why many view the stock market as a mysterious and uncontrollable creature. Left alone in front of the computer, the lonely investor awaits the big crash. We call those people “Crash-Prophets”, who are constantly conjuring up the collapse of the capital markets. They desperately defend that their main assets and asset classes would shield one’s personal wealth from such a crash.
The boogeyman, in this case, is neither the plague nor cholera, but currency reform, inflation, deflation, and bank crash. Often, we have the impression that a lot of people cannot differentiate between inflation/deflation and flatulence. Some analyze stocks in its smallest detail and expose scandals that turn out to be none.
The most important question, however, is what are those people good for and what do their followers gain from them? In principle, it is only suitable to be aware of the risks at the capital markets. But here, we are already talking about an ever-growing and reoccurring golem: the big crash! First, it was the crash that was supposed to come but didn’t – only to be replaced by the supposedly big crash. Probably the total crash is next. Or did that already happen in 2020? We don’t know and we have lost track of it, either. The last time somebody proclaimed the total war, the results were devastating for all participants. We should be more careful.
All these assumptions about crashes do not genuinely aim to facilitate the generating of money at the capital markets, which we are all here for. Often, the defenders of the crash-argument find satisfaction in seeing the fear in people, who are simply not sufficiently informed. Individually, they can make fun of people who believe in these downfall scenarios. In reality, that takes away once in a lifetime chances.
From a long-term perspective, every layman will recognize that after every corrective movement the course reaches new all-time highs. It is like ebb and flow, life and death. The circle closes over and over again and regardless of how severe these corrective movements are, they always served as launch pads for stronger upward trends.
We know about people’s fear of the capital markets. However, we are relying on mathematics and probabilities. Last year after we were convinced that the low points were reached, we did not shy away to voice our opinions on the markets. Our bullish orientation was greatly rewarded. Especially with our stock packages. Here, the picture that is drawn in the indices is even more clearly visible.
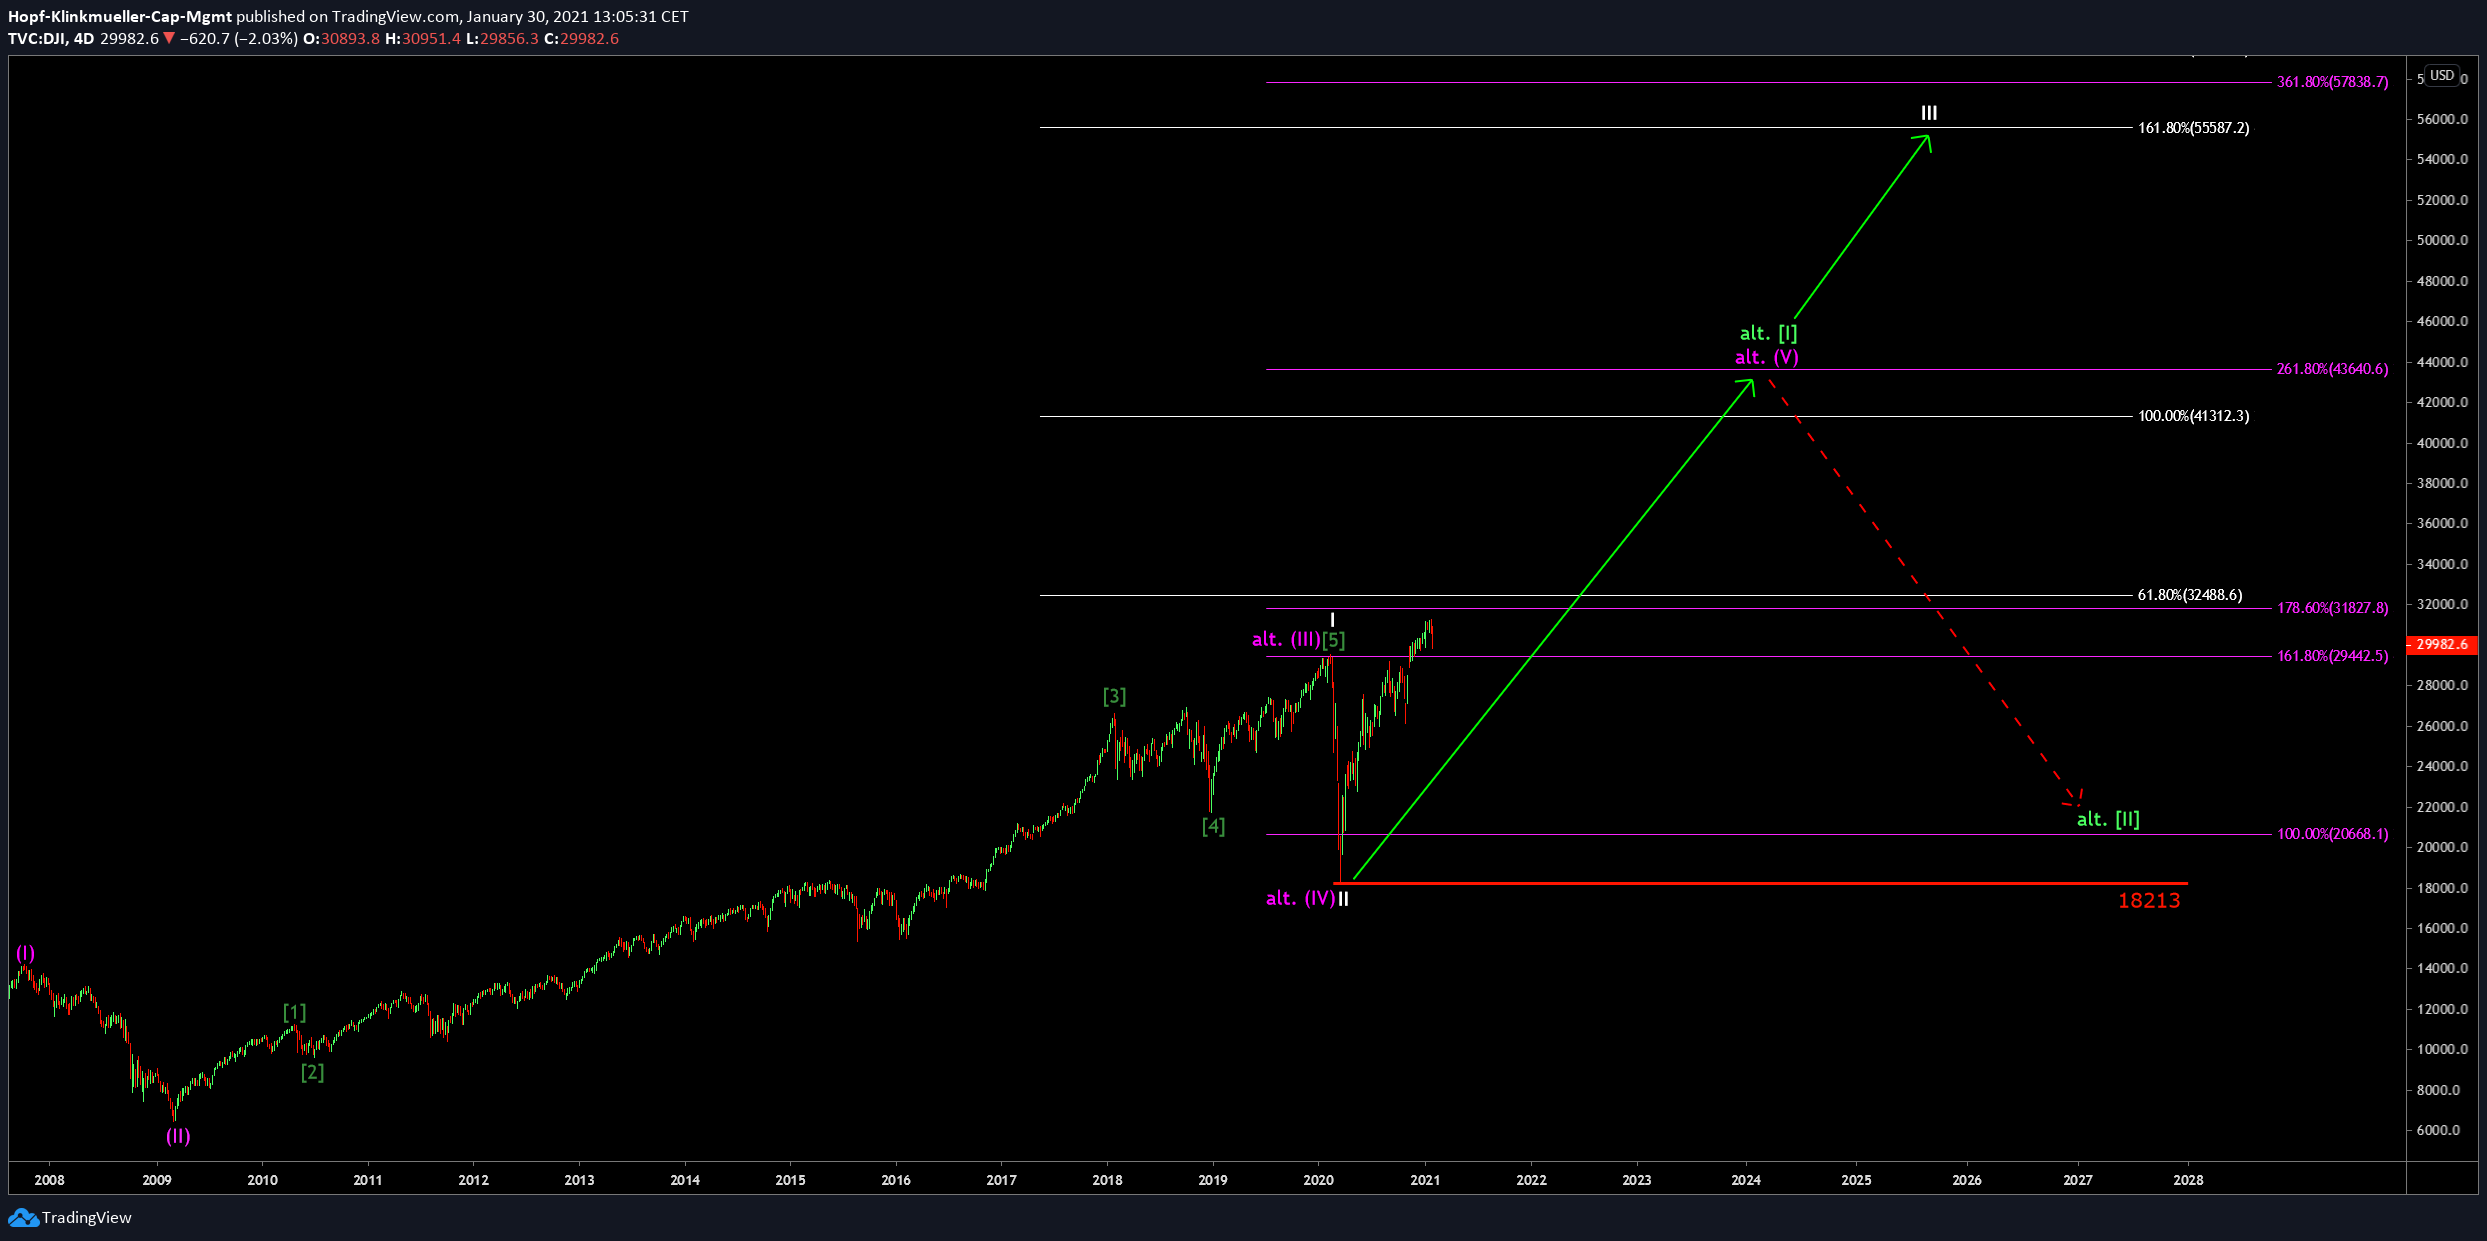
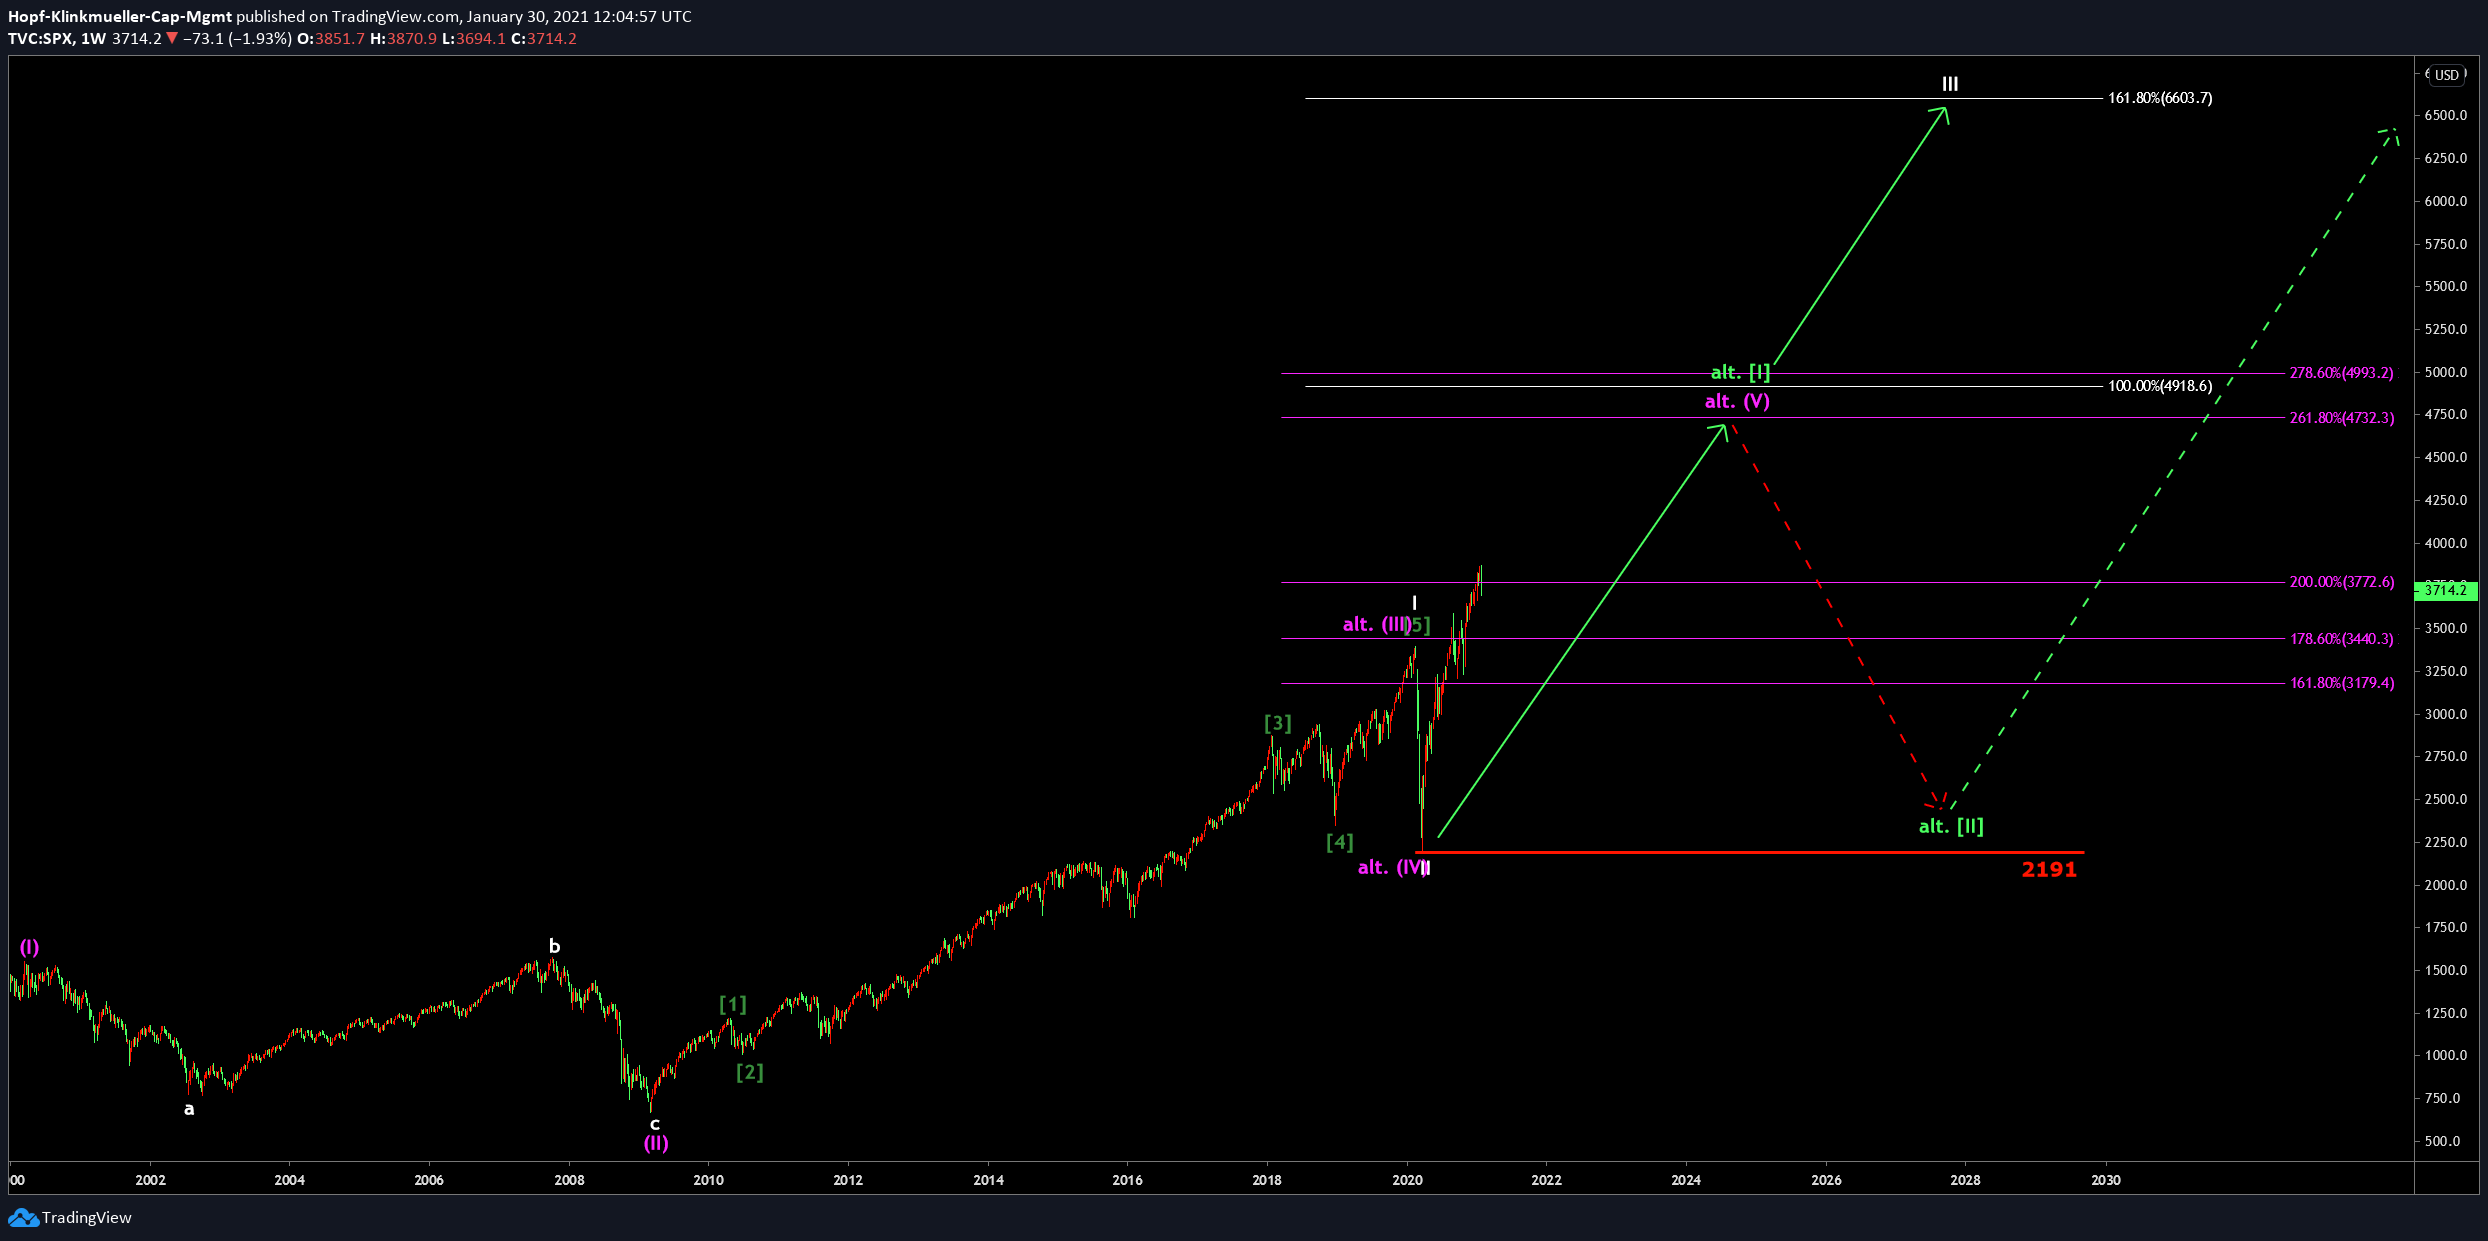
At this point, we would like to shock you with our course predictions – in a positive way of course! Dow Jones: 55000 points. S&P500 6600 points. That will not happen within a day and probably not this year, neither. We have to be the killjoys here, although we would not categorically exclude the possibility that the latter situation is possible.
Dow Jones 4D Chart
(Click on image to enlarge)
S&P500 4D Chart
(Click on image to enlarge)
In any case, we need to be clear about the fact that the movement will never be possible without intervening corrections. However, we are not expecting the reaper to await us right around the corner. What kind of phantasies are those anyways? Capitalism is grounded in the idea of constant growth. In combination with the current fiscal structures, the system has brought us growth and prosperity to an extent that was unthinkable somewhat 70 years ago. Many regions in the world are still experiencing the first steps of this development. Similarly to the stock markets, here, too, will be harsh competition for the top. It is up to everyone to spot the opportunities and do not be led into the darkness.
Returning to targets: if you were already shocked, you are best advised not to continue reading, because these were the preliminary targets on the way to much higher levels, which conclude the current movement. If it turns out to be true that the year 2020 was only the beginning of a great run, we see the Dow Jones rise to 80000 points and the S&P500 to 10000. After 2008, many claimed that the markets would never recover. Well, that didn’t work out too well.
On the way to the top, there will be all sorts of corrections, which are going to be framed as the end of all things. These corrections will be increasingly bigger in absolute terms, but also bounce back more quickly. The developments on the frontline of the economies will not be able to keep up with the pace of the capital markets, which they were never able to do in the first place. This discrepancy was long masked by the inefficiency of capital flows. A small-investor run on the GameStop stock would have been simply impossible in the 80s. Today, a trade is only a few clicks away.
The increased accessibility of the markets and the advancing technology will further facilitate the capital flow, which is coherent with the increasing explosiveness of the capital markets. Currently, the number of people who own stocks is a laughable portion of the global population. The United States of America are the leader in that category and shows us how the indices and the individual companies are positively affected by the amount of individual ownership. It is no coincidence that the American indices are leading the global markets. Among those prestigious indices, we will soon also analyze the NASDAQ and keep you informed with our updates. The potential of this index is very high, but we will elaborate on that in a separate article.
We could have summarized this whole article in one sentence with capital letters saying: “BUY STOCKS!” However, we felt like that would have been a little bit too straightforward. In the end, the timing is still very important, although being washed out in the long run. In that way, we cannot plan our financial future 30-50 years ahead but need to manage risks, partial sell-offs, and re-entries – all important factors for success. This leads us to the current developments in the indices.
If the corrections exceed the target areas on the downside, which are the marks of 29313 for the Dow Jones and 3608 for the S&P500, then we need to expect further short term declines. In any case, the chance to buy at lower prices is more than welcome. Our shorter-term price target is 33000 points in the Dow Jones and 4000 points in the S&P500.
Dow Jones 4H Chart
(Click on image to enlarge)
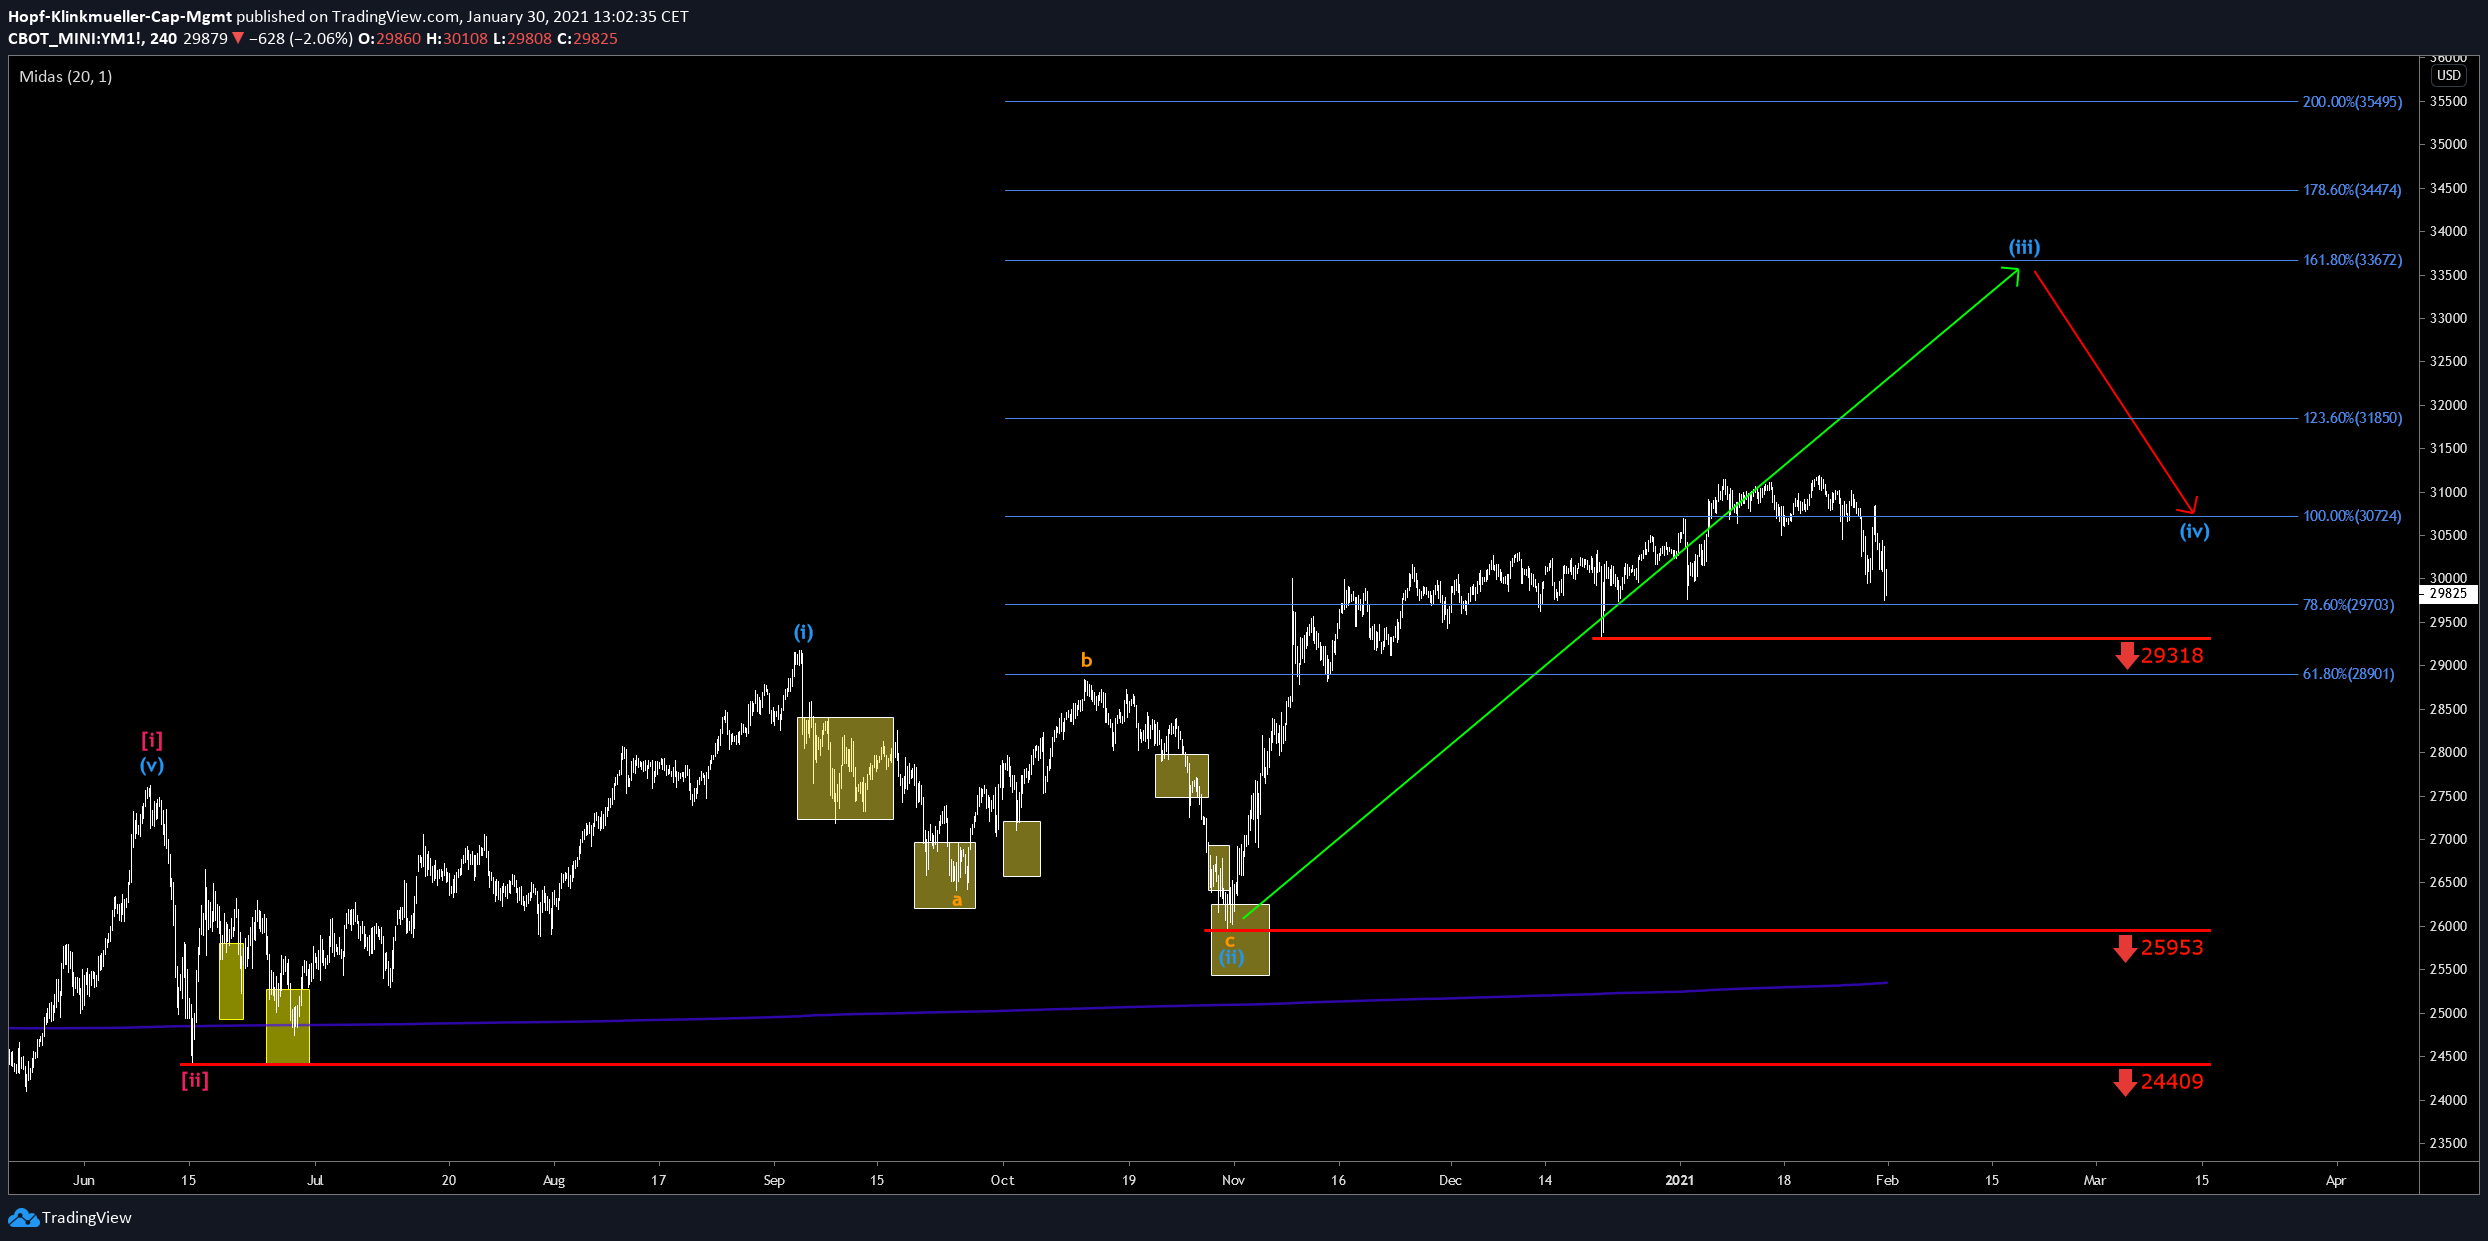
We can summarize that the indices are not facing too severe corrections in the immediate course of action. In the worst case, the corrections would expand to an extent similar to the ones in October 2020, which would be still acceptable. Additionally, this would lead to a steeper increase in the aftermath, as the course is building up the pressure so to say. Accordingly, there is no reason to be concerned, let alone think about collapses to the extent of the one in March 2020. Now, we are awaiting what the upcoming week brings. We will continue analyzing the charts from a closer perspective to identify relevant target areas. If you are looking for chances to enter the market, you should keep a closer look at the two indices in the coming week, as the entry windows might only be open for a very short amount of time.


If I were pitching to a group of VCs, these are certainly the graphs I would use. If you overlay the rate of innovation on your charts do you get a similar picture?
Thank you for your feedback.
Productivity has increased in many sectors during the pandemic. This is an interesting read regarding remote workings impact on call centers: www.economist.com/.../does-working-from-home-make-employees-more-productive
Technology will likely drive general productivity and innovation further. A chart for general innovation growth is sadly not too reliable in the longer term.
Good read, thanks.
Thank you for your feedback.