
Wall Street's Magic Act: Pick A Number. Any Number.
Like the magician imploring you to pick a number, the US stock market is pulling its own magic act. “24 times earnings? No problem. How about 34 or 44 times earnings? Sounds good to me”, says the magic man. And just like that the thought becomes reality – at least until it gets resolved either by price declining substantially or earnings rising equally substantially. None of what I just said you haven’t heard before and, at times, quite often and vociferously.
 The fundamental problem is rather straightforward: the multiple stocks sell at should have some relevance, some bearing, on the real world economic potential of the stocks in question. History is a good guide (16 times is the historical average for the prior 12 months S&P 500 on a GAAP earnings basis), so is the connection to the growth rate of earnings, which, as it relates to today’s US stock market, is illustrated as follows1:
What this table shows is the already high GAAP based P/E ratio for the S&P 500 will remain so provided earnings climb significantly, as in making a 22% jump over the next twelve months. The bottom line is this: when stocks come unmoored from their historical and objectively analytical levels, anything is possible. Any number is possible. There is no basis upon which any number is invalid.
Of course related to all this is the all-important level of interest rates. When it comes to stocks, interest rates serve a dual role: as an input into the valuation models for equities (it is THE key component in the discount rate) and as a competitive investment vehicle. In a related capacity, interest rates are part of the asset/liability equation for key investment players, most notably pension, insurance companies, and endowments, whose need to generate rates of return to meet their future needs drive the asset mix they employ. For example, a defined benefit pension fund has a required return built into its projected future contributions and liabilities to be paid out to beneficiaries of the plan. The plan also has limitations, restrictions, on how much can be invested in stocks and bonds. If the required return is, say, 8% and the asset mix restrictions is the historical standard of 60% stocks/40% bonds, generating that 8% return becomes virtually impossible when high quality bonds yield less than 5%. Hence the “reach for yield” we hear so much about2.
Lastly, interest rates also function as a metric to the central bank’s policies. This is tied to the Wall Street mantra of “don’t fight the Fed”. When the central bank wants to flood the economic and financial system with easy money, that money has to find a home somewhere and, in the process, inflate an asset category. If the easy money doesn’t find a home in the real economy, it most definitely finds a home in financial assets as the central hopes (and prays) that the magical wealth effect will work its wonders.
What is left out of all this is when economic conditions are well outside the norms – economic and financial, which is the case today. Many economists say we are in a “liquidity trap”3 and infusions of money will have limited effect. Others worry that deflation is part and parcel to this condition. I would add the fact that globalization and innovation are driving the cost of everything down, down, down – and that includes the cost of money. Perhaps that helps to round out the interest rate picture more completely and, in the process, helps explain that record low interest rates are there for a reason4 – a very worrisome reason.
But no matter to traditional Wall Street types as they must follow their traditional models as taught and exercised in their daily practice of managing other people’s money.
Investment Strategy Implications
Of the major indicators followed, there are 2 – divergences (see charts below) and valuation – that are negative for US stocks and one (mostly) positive – price action (both Mega Trend and MACD momentum – see charts below). For the bullish case, divergences can be resolved provided stocks continue to rally across all sectors and styles. And, of course, valuation is a subjective tool that, like a rubber band, can stretch to whatever width the mood of investors is willing to let it go to. And, in bubble phases, this can go on for quite some time.
The prudent course of action is to not get swept up in the arguments made justifying exceptional times. This is a hard thing to do if the pressure to perform weighs heavily on one’s work and career.
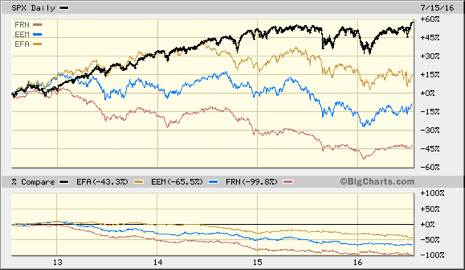
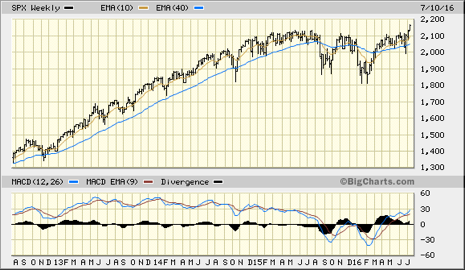
Chart 1: US large caps at record levels, every other major index nowhere near.
Note: The divergence principle is a simple one: markets do best when they confirm their actions, be it bullish or bearish, one to another. In the current US bull market, it is helpful to have other markets participate thereby confirming the move. Without confirmation, a move to higher highs (or lower lows) lacks the breadth that history has shown to be resolved in the direction of the laggards. In the current situation, the gap between the US and the rest of the world is substantial: from approximately 45 to 90%.
Chart 2: On an intermediate term basis (using the weekly charts), the Mega Trend is positive as price is above its moving averages, the 50 day (10 week) moving average is above the 200 day (40 week), and momentum (MACD) is positive.
This is the case also on a daily basis but only a Mega Trend but not momentum basis on a long term/monthly basis.
***
1 Stocks sell at a discount to their future value. This discount is known as the required return – the rate at which stocks should generate to justify taking the risk of an uncertain future. In the past, this return averaged around 11%, meaning the current price of the stock market is 11% below where it will sell in 12 months.
2 Which helps explain this year’s leadership sectors in the yield categories of Utilities and Telecom.
3 A liquidity trap is a situation, described in Keynesian Economics, in which injections of cash into the private banking system by a central bank fail to decrease interest rates and hence make monetary policy ineffective.
4 This was discussed in detail at my April 7 event in New York - and on the related Bloomberg radio segment
Disclosure: Accounts managed by Blue Marble Research may presently hold a long/short position in the above mentioned issues and their inverse comparables.


