Wall Of Worry?
Investors continue to climb the wall of worry. Global equities are back over 1-month highs – erasing the pain of December. Progress on US/China trade talks is the nominal driver. There are, however, plenty of issues blocking a stampede for the bulls. The wall is well understood:
- The US government shutdown reaches day 28 – four weeks – with no clear end in sight.
- UK Brexit Plan B doesn’t seem to include much new material – making Monday a risk for disappointment – as EU seems less inclined to new talks
- China GDP revised lower in 2018 and the outlook for 4Q 2018 is 6.4% consensus with some calls for 6.2%
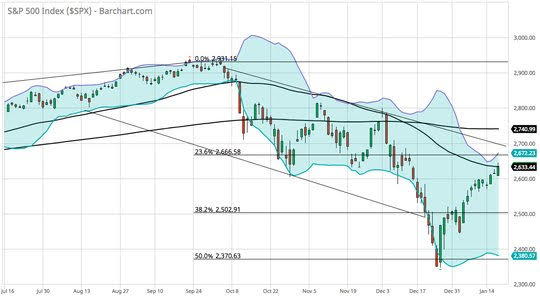
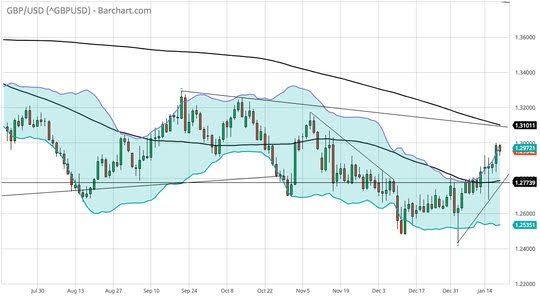
The risk and reward on the day is about the extension of the S&P500 to 2700 and the climbing of the wall of worry based on China hopes. The set up for the weekend and the rest of the month seems strained and the two charts to consider into a cold and snowy weekend are GBP and the S&P500 with both showing signs of a overextension. The data ahead and real news seem set up to clash with the price reactions. This is how bear market corrections work and how FOMO leads to a collapse.
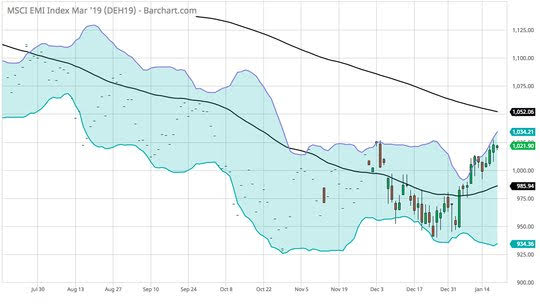
Question for the Day:Is the rebound in EM sustainable? The drivers for 2019 bullishness have been – 1) Better trade talks between US/China, 2) FOMC pause expectations – as the FOMC rate hike risks for 2019 remain below 20%, 3) Brexit delay hopes after May wins a no-confidence vote but loses her Brexit plan, 4) Better 4Q earnings so far. All of these points have little to do with the emerging markets but they melt up the outlooks for global growth. Even as the outlooks for the US are marked down.
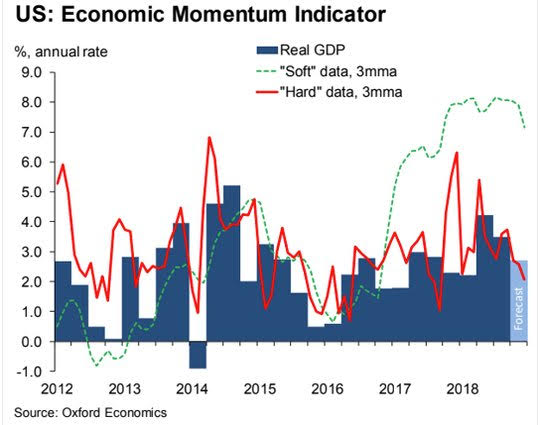
This is the relative story with the risk in the next week revolving around China and its growth data. China matters more to global growth and EM growth in particular. Investors maybe buying what they see as “value” but risk a nasty reversal should the US/China talk hopes prove more a truce than a deal. EM funds attracted $3.3bn for the week ending Thursday, according to EPFR Global data, extending the run of inflows for the asset class to 14 weeks. This brings the total flows to the asset class over the past three months to $27.5bn, reversing periods of acute outflows seen throughout the year. EM bonds have also benefited from the change in sentiment. EM bond funds drew $2.4bn for the week ending Thursday, the largest weekly figure since late January last year, according to EPFR Global figures.
What Happened?
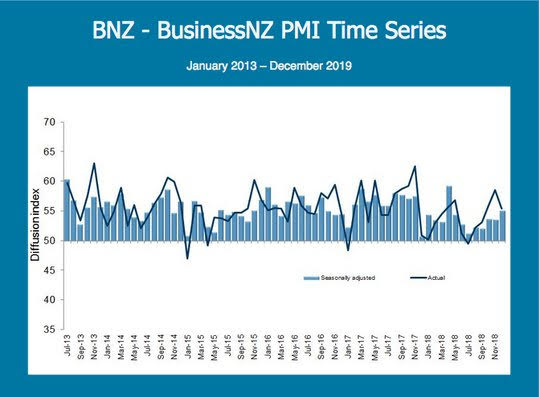
- New Zealand December BusinessNZ PMI up 1.4 to 55.1– better than 52 expected – led by inventories. 2018 averaged 53.8 in activity, slightly ahead of the overall average of 53.4 since the survey began. However, it was still a noticeable dip in expansion compared with 56.2 over 2017 and 56.0 over 2016. Looking at the main sub-index values, new orders (56.1) still remains in healthy territory, although it was interesting to note that finished stocks (58.6) was at its highest level since the survey began.
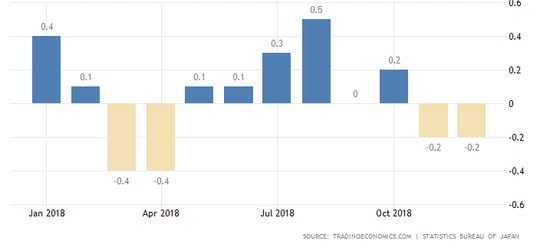
- Japan December CPI -0.2% m/m, 0.3% y/y after -0.2% m/m, 0.8% y/y – less than the 0% m/m, 0.6% y/y expected. The core fell to 0.7% y/y from 0.9% y/y – also less than 0.8% expected. The core-core held 0.3% y/y. Service inflation was 0% after 0.3% m/m while goods was -0.6% after +0.2% m/m. Largest increase was in furniture up 0.5% m/m while transport fell 0.9% and food fell 0.6% m/m.
- Japan November final industrial production revised to -1% m/m, +1.5% y/y after 2.9% m/m, 4.2% y/y - slightly better than-1.1% m/m, 1.4% y/y preliminary. The inventories rose 0.1% m/m, 0.6% y/y while the shipments fell 1.2% m/m, +0.9% y/y putting the ratio to -2.2% m/m, -0.3% y/y.
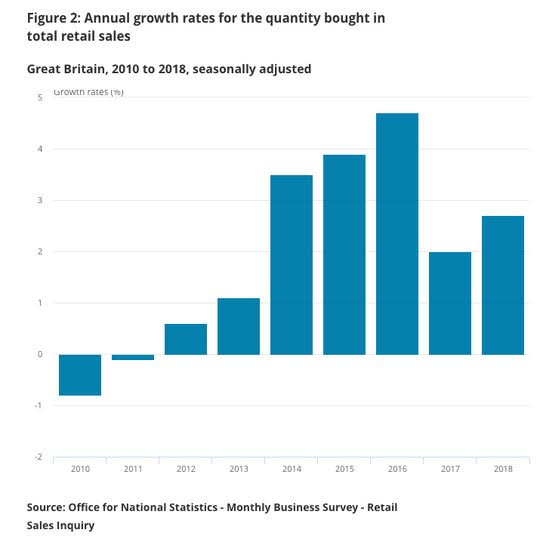
- UK December retail sales -0.9% m/m, 3% y/y after revised 1.3% m/m, 3.4% y/y – weaker than -0.7% m/m, 3.5% y/y expected. The ex fuel sales slowed to 2.6% y/y from 3.5% (revised down from 3.8% preliminary) – also weaker than 4% y/y expected. For 4Q, sales quantity fell 0.2% ex Fuel. The December on-line retailing was 20% of the total up 13.9% y/y.
Market Recap:
Equities: The US S&P500 futures are up 0.4% with 2700 the next key resistance after gaining 0.76% yesterday. The Stoxx Europe 600 is up 1.4% - set for a 1.9% gain for the week. The MSCI Asia Pacific rose 0.55% on the day and up 1.3% on the week.
- Japan Nikkei up 1.29% to 20,666.07
- Korea Kospi up 0.82% to 2,124.28
- Hong Kong Hang Seng up 1.25% to 27,090.81
- China Shanghai Composite up 1.42% to 2,596.01
- Australia ASX up 0.53% to 5,941.20
- India NSE50 up 0.02% to 10,906.95
- UK FTSE so far up 1.55% to 6,941
- German DAX so far up 1.7% to 11,103
- French CAC40 so far up 1.7% to 4,874
- Italian FTSE so far up 1.1% to 19,686
Fixed Income: Higher equities still the story more than economic growth data or policy shifts – bonds are offered but limited in the move – German 10-year Bunds up 2bps to 0.26%, France OATs up 2bps to 0.66%, UK Gilts up 1bps to 1.35%. Periphery better with Italy of 3bps to 2.73%, Spain off 2bps to 1.35%, Greece off 3bps to 4.19% and Portugal off 3bps to 1.59%.
- US Bonds lower tracking equities, curve flatter– 2Y up 2bps to 2.58%, 5Y up 2bps to 2.59%, 10Y up 2bps to 2.77% and 30Y up 1bps to 3.08%
- Japan JGBs in check despite equities on weaker CPI– 2Y flat at -0.17%, 5Y up 1bps to -0.15%, 10Y up 1bps to 0.01% and 30Y flat at 0.7%.
- Australian bonds sold in catch-up to US and on China hopes– 3Y up 5bps to 1.83%, 10Y up 5bps to 2.34%.
- China bonds mixed with curve steeper – waiting for data– 2Y off 4bps to 2.59%, 5Y up 3bps to 2.92%, 10Y up 2bps to 3.12%
Foreign Exchange: The US dollar index off 0.05% to 96.02. In Emerging Markets – USD mixed– EMEA: RUB up 0.1% to 66.33, ZAR off 0.4% to 13.775; ASIA: INR off 0.15% to 71.135, KRW up 0.1% to 1120.35
- EUR: 1.1405 up 0.15%.Range 1.1386-1.1410 with focus on risk more than FX – 1.1380-1.1450 keys.
- JPY: 109.40 up 0.15%and EUR/JPY 124.80 up 0.45%. Range 109.06-109.60 with risk for 110 test in play linked to equities.
- GBP: 1.2940 off 0.35%and EUR/GBP .8815 up 0.5%. Range 1.2927-1.2994
- AUD: .7195 flatwith NZD up 0.1% to .6770. Range .7175-.7205 with focus more on crosses and commodities. NZ PMI strong enough to help.
- CAD: 1.3265 off 0.1%.Range 1.3250-1.3283 with oil and rates in play – data still key. 1.3250 pivotal for 1.3080 risk
- CHF: .9940 flatand EUR/CHF 1.1335 up 0.2%. Range .9932-.9947 with focus on risk not safe-havens with .9880-1.00 keys.
- CNY: 6.777 off up 0.05%. Range 6.7670-6.7810 with focus on trade talk hopes and equities against host of day ahead 6.73-6.80 still key.
Commodities: Oil up, Gold down, Copper up 1.05% to $2.7235.
- Oil: $52.86 up 0.95%. Range $52.37-$53.20 with OPEC monthly helping $52.50 break and opening $54 test today. Brent up 0.8% to $61.66 with $62.12 highs and $62.50 focus.
- Gold: $1285.60 off 0.5%. Range $1283-$1292.20 – less need for safe havens with equities driving more than USD – $1283 breaking means $1268 risks. Silver off 0.25% to $15.50, Platinum up 0.15% to $813.50 and Palladium up 1.9% to $1374.20 –all on China stimulus/car catalytic demand.
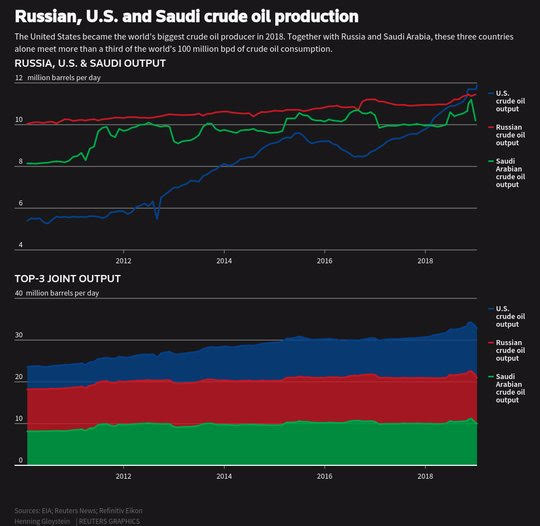
Conclusions: Is the OPEC drop in production enough to support oil in 2019? Oil continues to play a key role in US markets with the HYG connection the first point, the cost to consumers and business mixed given the rise of the US in 2018 as the largest producer and as exports of oil become part of the story for the economy. The US energy independence story has big broad implications for the current account, the way oil prices filter into the economy and to how the FOMC may react to oil price noises. This makes today’s OPEC monthly oil report and the rise up in oil prices overnight less powerful a signal for global growth demand and more about global political issues.
Economic Calendar:
- 0830 am Canada Dec CPI (m/m) -0.4%p -0.4%e (y/y) 1.7%p 1.7%e / core 1.5%p 1.5%e
- 0905 am NY Fed Williams speech
- 0915 am US Dec industrial production (m/m) 0.6%p 0.2%e (y/y) 3.9%p 3.0%e / manufacturing 2%p 1.8%e
- 1000 am US Jan preliminary Univ.Michigan consumer sentiment 98.3p 97e
View TrackResearch.com, the global marketplace for stock, commodity and macro ideas here.


Consumer sentiment that drives 70% of the US economy strongly suggests this is only a bear market rally, see:
seekingalpha.com/.../3424272-consumer-sentiment-unexpectedly-tumbles
This is way more important that hot air from trade talks...
Wall of worry or PPT?