
VIX Will Be Key Today
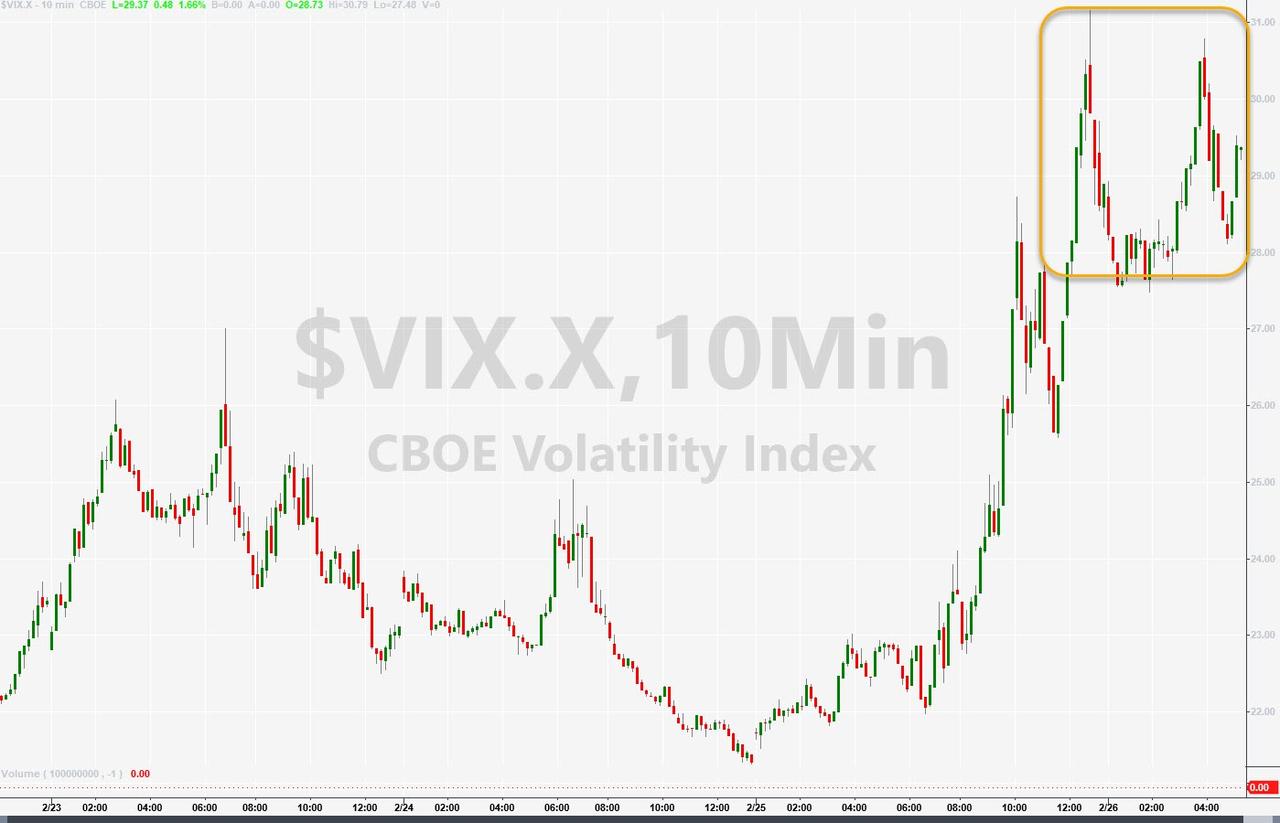
Amid all the bond-related headlines yesterday, few noticed the huge spike in VIX (and vols broadly) that also hit. The 'fear and greed' index spiked from around 22 to over 31 and is holding those gains in the pre-market...
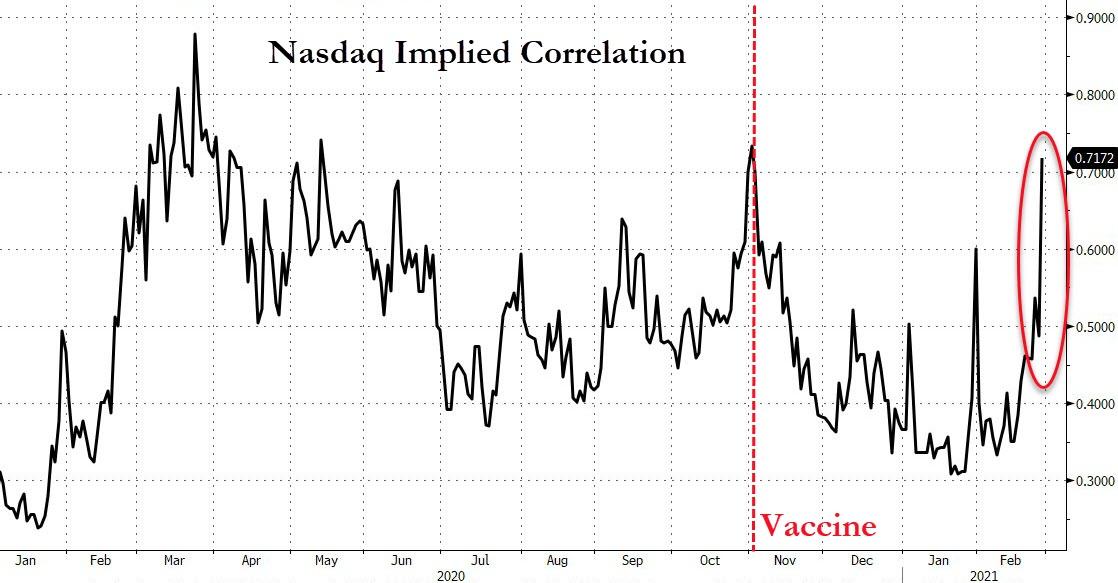
And yesterday's surge in implied correlation suggests major macro overlays were put in place (which could mean rotations from macro hedges to micro hedges today).
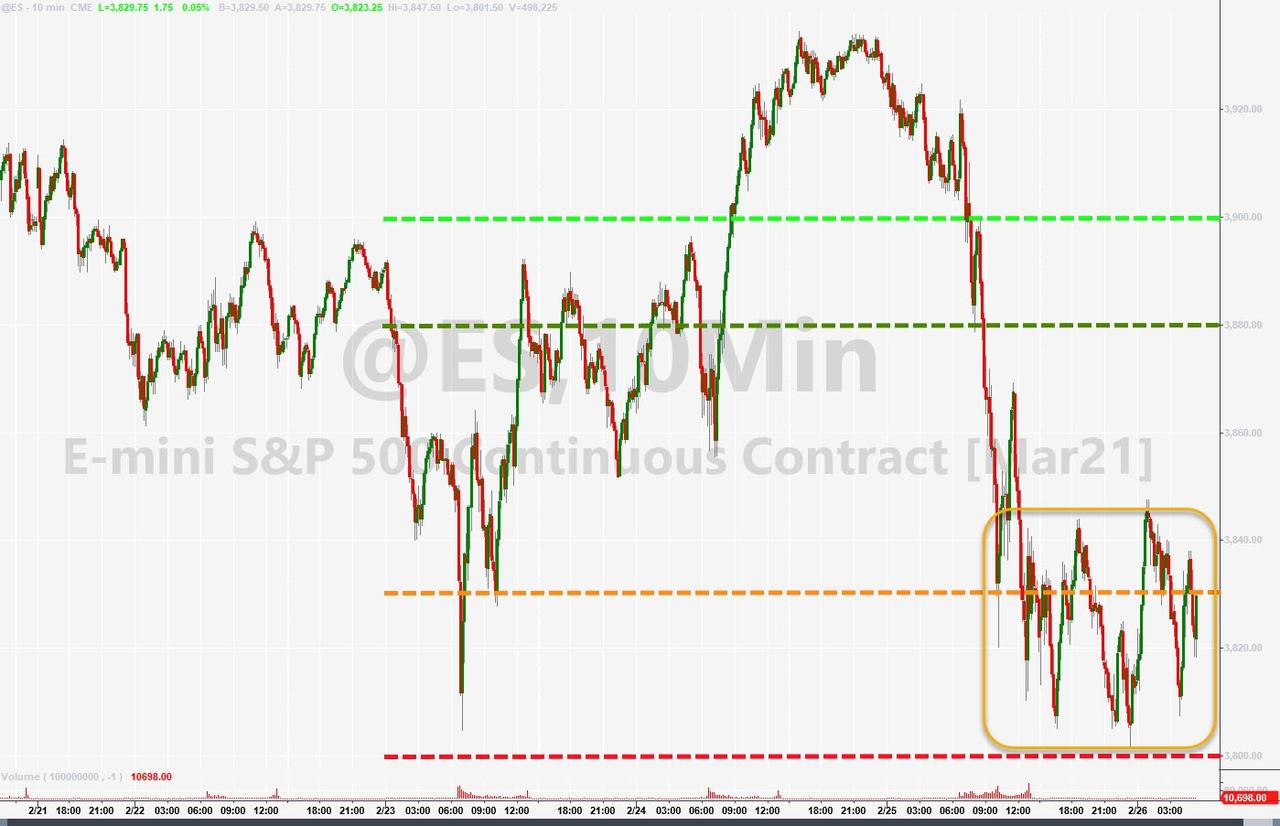
Futures are holding 3825 after putting in a 3800 low and 3850 high, but, as SpotGamma warns, VIX will be key today, if it declines then we think a move back up into the 3900 area is quite possible.
If VIX continues higher then we think the market stays under pressure.
A few days ago we talked about the VIX and the contango, and how quickly the VIX could snap-back due to how steep that curve was. The image below shows the implied volatility level of at the money SPX options and how that snapped from contango to backwardation.
The lower red circle highlights data from Wednesday, the day of the big market rally. You can see how drastically that differs from yesterdays market.
We highlight this chart, as if the options prices decline significantly from yesterday (top red circle shifts to lower red circle) that can be a “buy” signal as it indicates implied volatility is declining ( vanna, as discussed last night). Unless you are a volatility quant, we generally just recommend watching the VIX to detect SPX options price changes.

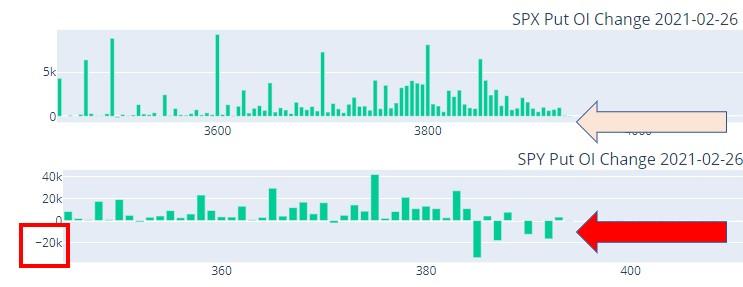
SpotGamma also highlights one key aspect of yesterday's trading:
we did not see any SPX strikes which a net close of puts. However, the SPY showed net closing of puts for all strikes >=385. This indicates to us that “retail” took their gains, but “institutions” held their protection
Key levels for today are 3800 (large gamma strike), 3830, 3880 (large combo strikes), and 3900.
Additionally, Sven Henrich (via NorthmanTrader.com), suggests longer-term structures that point to a major volatility event to come.
First off the big structure with the potential cup and handle pattern originally outlined remains fully intact:
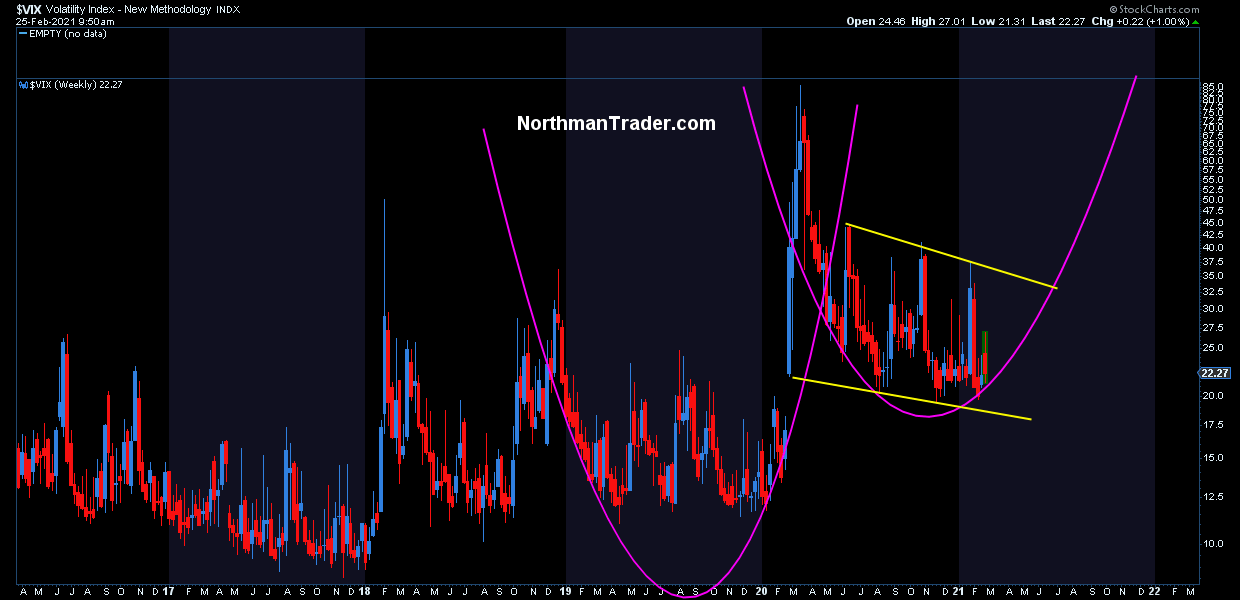
But now with a couple of volatility events into the year, we can also note a forming compression pattern, lower highs, and lower lows. Look no further then to 2017 to see that these types of structures can take many months to form and to ultimately break out higher triggered by some sort of event.
Looking at the daily chart we get a clearer picture:
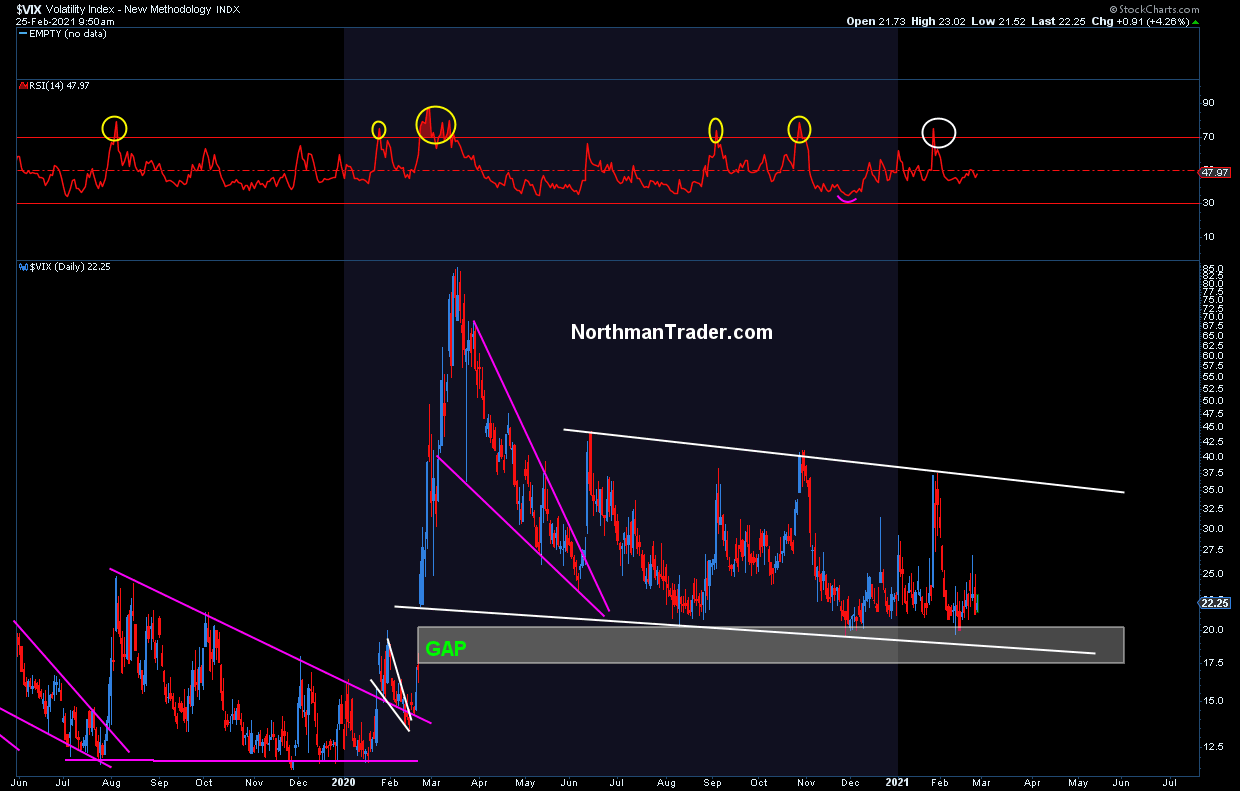
The unfilled February 2020 gap remains glaringly untouched. And it is historically very odd frankly. $VIX has had every excuse in the book to fill this gap by now. Fear you say? What fear?
$CPCE put/call ratio
— Sven Henrich (@NorthmanTrader) February 25, 2021
¯\_(ツ)_/¯ pic.twitter.com/XowqrlDq59
There’s no fear in this market.
Rather what we do see is the $VIX systematically moving to fill up gaps as well down gaps. Get to many unfilled gaps to the downside and they get filled, get too many down gaps and they get filled. A permanent ping pong game.
Indeed this week’s downdraft in markets stopped as $VIX filled another outstanding gap above:
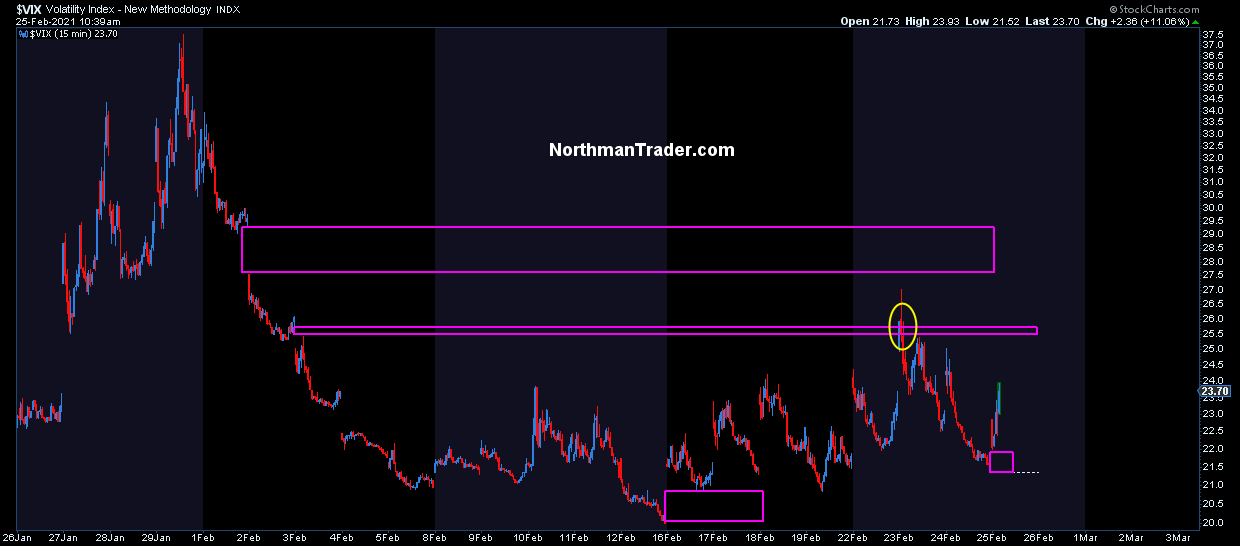
This gap-fill then served as a pivot point for equities to rally higher (see also Technical Pivots). Now we have 2 lower open gaps again above the February 2020 gap suggesting these gaps will get filled at some point in the next month or two. Yet the early February gap still remains open suggesting $VIX also has an appointment with this gap still.
Point being is volatility remains historically high even with record market highs which is not unlike what we saw during the year 2000 tech bubble.
...
Unfortunately, these $VIX structural charts can’t tell us the day or hour. They merely inform us that something major is in process of building.
Copyright ©2009-2021 ZeroHedge.com/ABC Media, LTD; All Rights Reserved. Zero Hedge is intended for Mature Audiences. Familiarize yourself with our legal and use policies every time you engage ...
more

