VIX-SPX Correlation Testing Investors’ Psyche
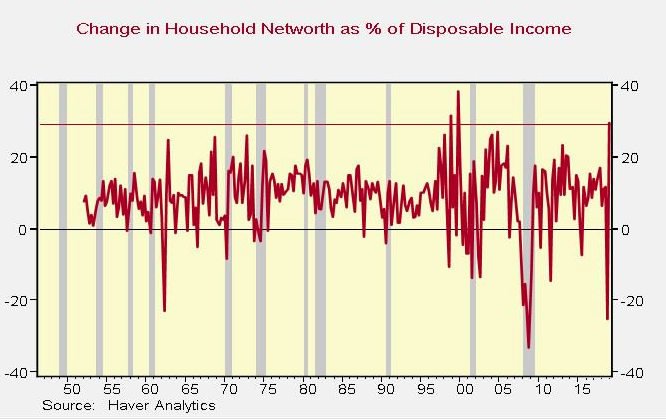
The following screenshot depicts just how quickly the economic situation can change with an equity market near it’s top and as a major correction takes place, only to be followed by a V-shaped recovery.
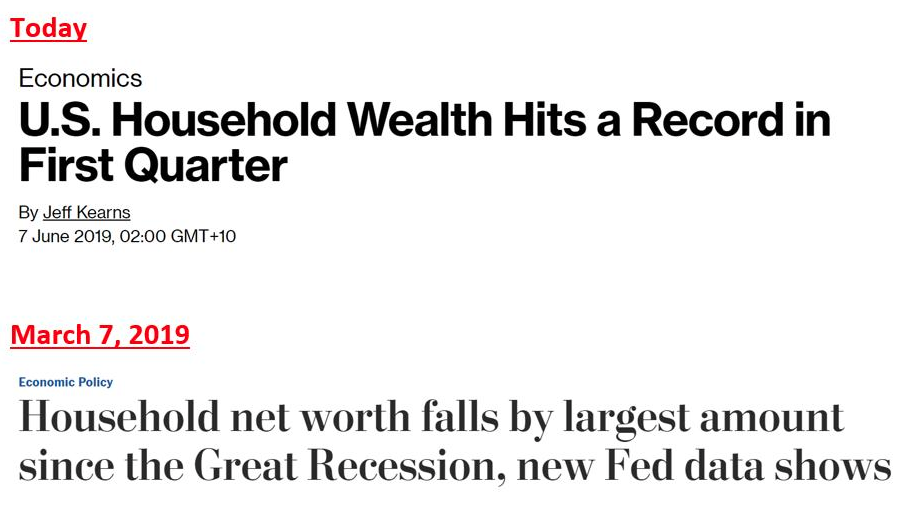
Household net worth had the biggest one-quarter decline, outside of the great recession, followed by the biggest one-quarter jump, outside of the tech bubble.
This ain't your grandfather’s stock market folks. If you’ve been disappointed that attempts at calling a top in the market rally or bottom in the recent pullback; don’t think you’re alone in that belief. Many market participants have failed with these predictions and analysis.
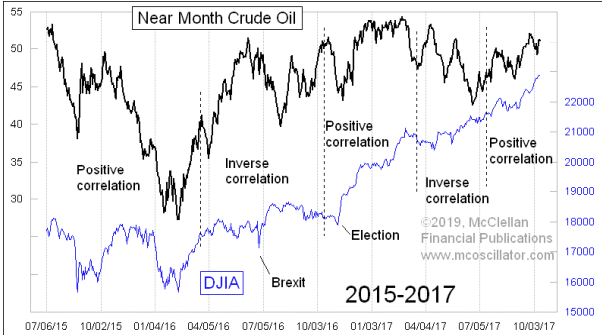
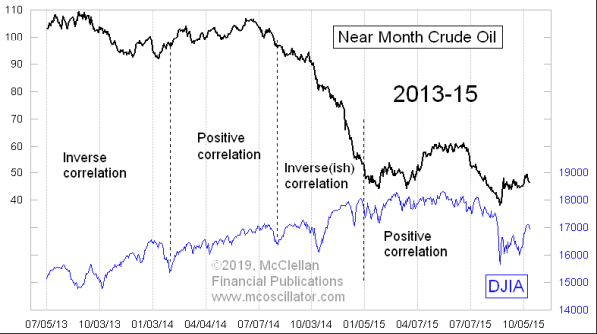
If there has been one chart or one set of correlated charts that identified greater probability of where equities are heading next it has been the Crude oil-S&P 500/DJIA charts. For this particular narrative, we’re going to utilize the Crude oil-DJIA correlation, given the relevance of oil and industrials.
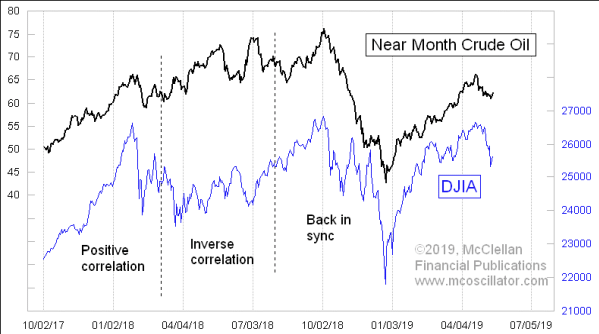
Oil and stocks have been in a strong positive correlation since around the beginning of August 2018. But for the 5 months prior to that start point, they were in an inverse correlation. And they were in a positive correlation leading up to March 2018.
In order to explain the relationship of equities to oil prices here is what Tom McClellan has to offer on the subject matter:
It makes sense in one respect that there should be an inverse relationship. After all, higher oil prices are inflationary, and that could lead the Federal Reserve to hike short-term interest rates, potentially harming the stock market. Higher oil prices also impact the corporate earnings of companies, which use petroleum products to make or ship things (although having higher oil prices helps the companies selling the oil). High prices for oil leads to higher gasoline prices, which impacts the consumer’s ability to spend money on other things.
A positive correlation makes sense when we realize that a lot of the high-yield debt out there has been issued by oil drillers and others in that industry, who might have trouble if oil prices fall too much. Low oil could endanger those companies’ ability to make debt payments, which could lead to defaults, harming the banking sector, and soaking up liquidity that might be otherwise available to lift stock prices.
What we can see from this most recent 1-month chart of Crude oil and the DJIA index is that over the last 30-day period, an inversion has commenced as crude oil prices have fallen while the DJIA has been relatively stable.
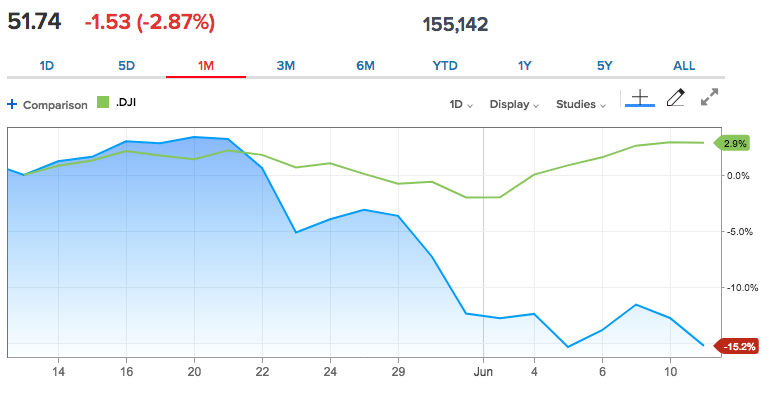
Having said that, crude oil prices are falling sharply on Wednesday morning and finding U.S. equity futures under pressure for the first time in the last 7 trading sessions. Are the equity futures pressure due to crude oil prices falling or because of other extenuating factors related to anxieties over global trade feuds and weakening economic data remains an unknown. It’s for this unknown that it is likely a best consideration to tread cautiously and recognize that uncertainty has loomed large throughout the 2019 market rally, pullback and secondary rally.
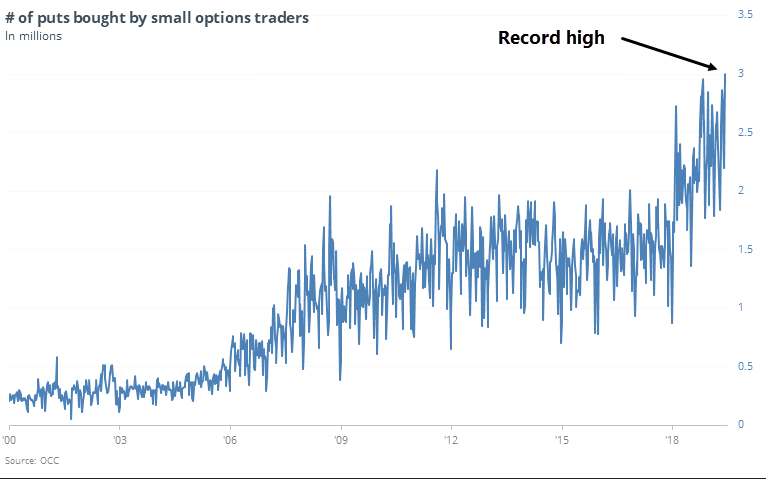
Another market correlation has captured the attention of investors recently and that correlation is the VIX-S&P 500 correlation. This is a correlation that is uniquely consistent, but nonetheless also finds itself inverting from time-to-time with little reactionary consequence, until more recently or over the last couple of years. It’s the recent VIX buoyancy that had caught the attention of investors and market participants that has fueled concerns around the recent 5% market snapback rally, which butted up against the threat of Mexico tariffs and a near-term G-20 Summit meeting between President Donald Trump and President XI of China. But whatever the reason for the VIX buoyancy, market participants have been hedging at their greatest rate. They bought to open more than 3 million put options for the first time ever last week.
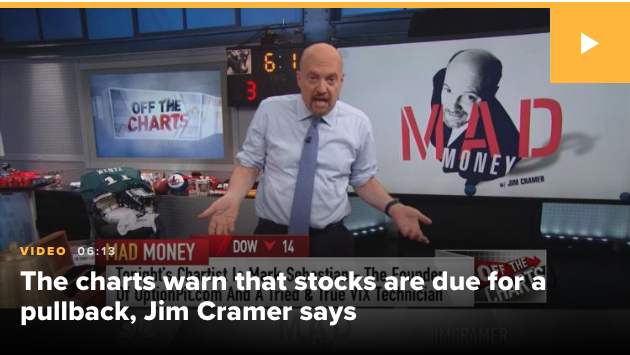
The current VIX-S&P 500 inversion has also caught the attention of Mad Money host Jim Cramer who offered the following commentary and analysis from Mark Sebastian of the Realmoney.com.
“Comparing the action in the S&P 500 and the VIX — the CBOE Volatility Index that gauges investor sentiment — there is reason to wait before adding more holdings to a portfolio, according to one of the “Mad Money” host’s colleagues at RealMoney.com. The charts, as interpreted by Mark Sebastian, suggest we are due for a bit of a pullback.”
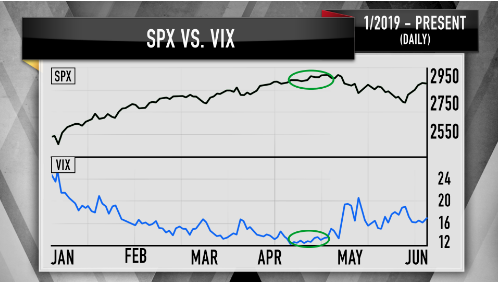
The S&P 500 in the past five trading days has expanded 5%. The VIX index initially fell from nearly 19 points, which Cramer called “textbook rally action.” However, the volatility measure has hovered in the high 15-point to low 16-point range since Thursday’s session as the S&P kept climbing.
“For the past couple of years, almost every time the VIX and the S&P rally together, the markets quickly had some sort of sell-off. The most notable one was in January of last year” as illustrated in the longer-term chart below.”
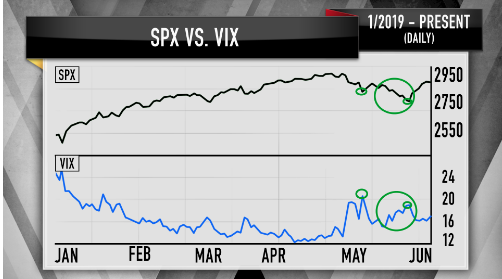
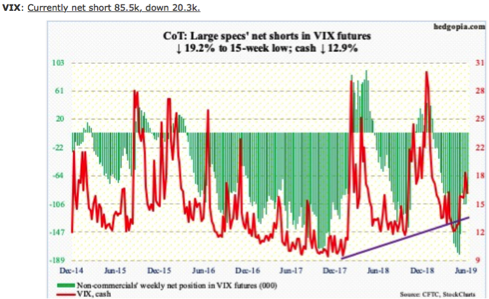
We all know the anomaly that came to be in February of 2018, which was predetermined by the outsized short-VOL positioning from 2017 and through January 2018. On February 2018, the largest 1-day spike in the VIX led to a significant rebalancing in the VIX Futures market. The result of this rebalancing assumed a subsequent dramatic sell-off in the equity markets as a result of investors and fund managers demand for liquidity stabilization was found by disposing of equity positions. But with regards to the present situation, that is not what is occurring as the short-VOL positioning has actually been usurped in many different areas of the Volatility complex, including the VIX-ETPs and VIX Futures market, by long volatility positioning. Even with noncommercial VIX-Futures positions reaching record levels in April, this didn’t produce a similar February 2018 Volmageddon event. Additionally, noncommercial VIX-Futures short positions have been greatly curtailed since late April.
Given the current obstacles to investor sentiment that are highlight by near-term events, Mark Sebastian suggests that the S&P 500 should pull back for a couple of days, creating buying opportunities. Then the market can have a “slower, more logical and methodical rally.
With oil prices heading lower on Wednesday and equity futures following suit in the 7:00 a.m. hour, the VIX is also moving higher. The alarm bells aren’t ringing just yet and even after a sharp intraday reversal in the markets. All major indices started Tuesday on the right foot, with the S&P 500 up more than 20 points to 2,910. Unfortunately, as the European market closed all those intraday gains were wiped out. The S&P 500 created a shooting star and bearish engulfing pattern over the last 2 trading sessions. An engulfing pattern is when higher highs & lower lows occur. On Tuesday, the S&P 500 was down .5% from the open to the close. (Charts from Troy Bombardia)
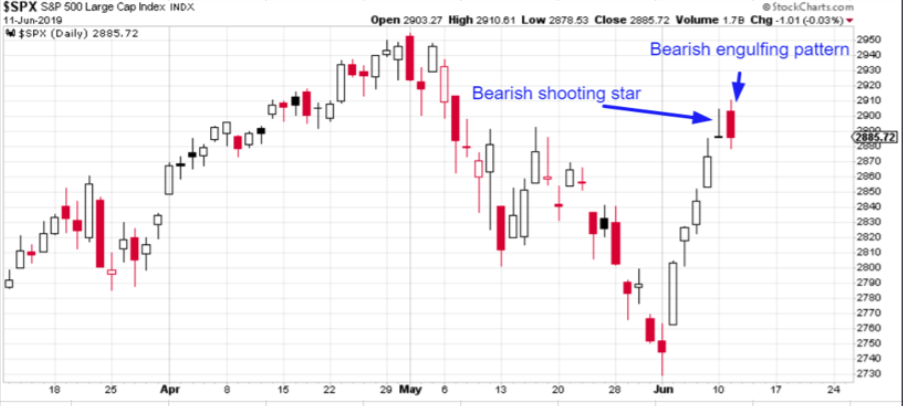
While we wish we could suggest there was something favorable about such a market performance and/or pattern creation, the sample size is just too small to qualify. In fact, the only other time this happened in history was on September 21, 1987. We all remember what happened in October of 1987, besides the World Series!
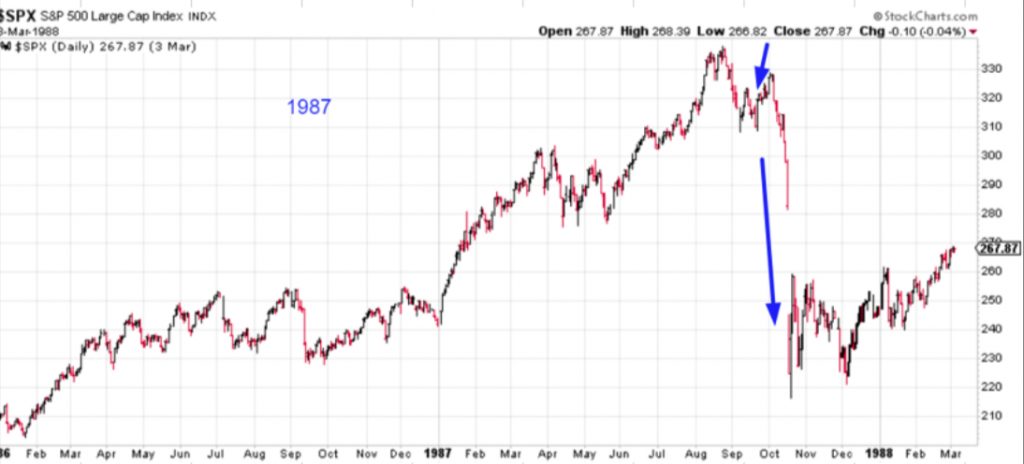
Yes, that was merely sensationalistic documenting, but nonetheless, the aforementioned chart pattern shows itself to be quite unique and demands attention and/or caution on the part of investors.
Possibly of greatest importance to investors is the upcoming Fed 2-day meeting that begins next week Tuesday.
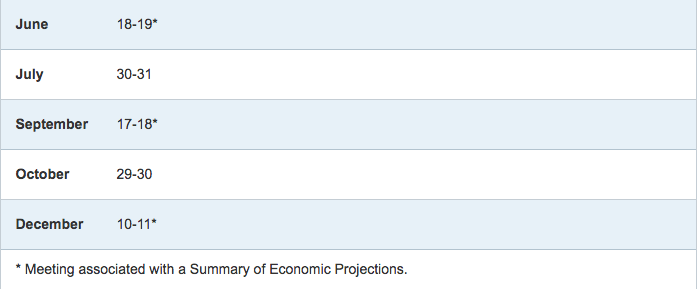
Investors will be paying close attention to what the FOMC offers in its policy rate announcement as well as its statement regarding the economy. To more appropriately define investor sentiment as it relates to FOMC rate decisions going forward, investors desire to hear that the Fed is readying to cut rates. Whatever language or verbiage the Fed offers, the market is pricing in Fed rate cuts and will desire to hear the Fed validate the markets demands.
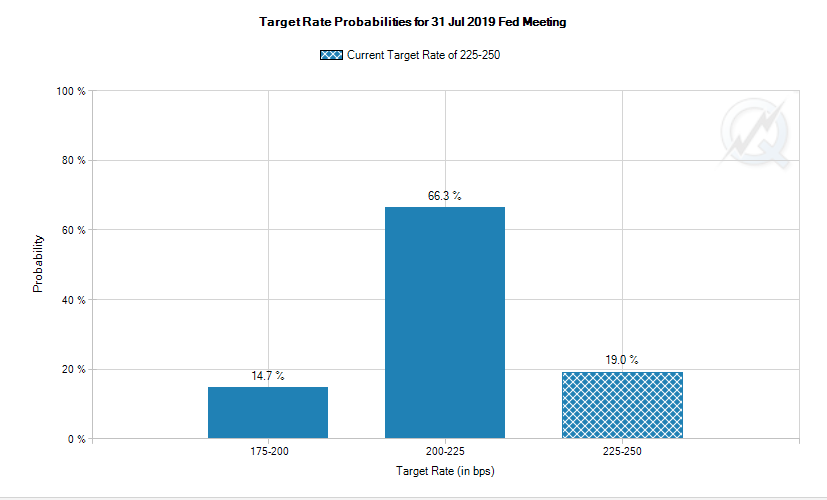
While the market is not expecting a rate cut at the June meeting, the probability for a rate cut in July has risen to 80% as of 6/12/2019. Analysts and economists have varied opinions on whether or not the Fed would or should cut rates.
- Morgan Stanley: “Fed could cut as soon as July but it may not halt slowdown/recession... we would be wary of any claims that costs will be passed along to end market consumers or absorbed by cost efficiencies .. companies are already struggling to take price or maintain margins. Thus, we believe an exogenous cost shock would be very hard to absorb.”
- UBS: 1. We only see the Fed cutting rates if we get a sufficient slowing in the real economy that they fear a recession. An equity sell-off would accompany that slide in the economy, but by itself, it seems insufficient. Tariffs increase the probability of recession. In our baseline, we continue to assume that deals are struck before meaningful further escalation occurs. However, in worst case tariffs case, US GDP could be reduced something on the order of 150 to 250bps. Depending on the concentration of this impact, we think the US could easily slip into recession. If so, the Fed will cut rates.
- Bank of America Merrill Lynch: Sees the Fed cutting interest rates by 75 basis points by early 2020. They see rates starting to be cut in September.
- Barclays: Fed will cut interest rates by 50 basis points in July, and an additional quarter point in September.
- Citigroup: expects the U.S. Federal Reserve to reduce key U.S. borrowing costs by 50 basis points in September, followed by a 25 basis-point rate cut in December. There is a “material risk” of a 25 basis-point rate decrease at the Fed’s July policy meeting and “maybe a premature end” of its balance sheet runoff in June, due to a challenging global environment and sluggish domestic inflation, Citi FX strategist Ebrahim Rahbari.
- Deutsche Bank: Peter Hooper, chief economist at Deutsche Bank Securities, still has the Fed holding interest rates steady this year. Hooper said the latest trade dispute between Mexico and the U.S. “could go either way.” He said next week’s May retail sales report would be key to the outlook.
Undoubtedly the global trade feuds between the U.S. and… well, you name it has given the Fed cover to cut rates in the near future, even without tariffs having been placed on Mexico this past weekend. But more importantly, is the current economic data that shows or proves the Fed’s dual mandate can and is being called to question. With the trending, slowing growth in job creation on a YoY basis and inflation remained under pressure, both aspects of the Fed’s dual mandate of employment and inflation give the central bank cover to move forward with an insurance rate cut. Here’s what Edward Cordoba of Finom Group had offered just yesterday in a call with investors that discussed the rationale for a rate cut:
“A symmetric inflation target is no better than have a fixed-target rate and given the headwinds for inflation that the Fed is well aware of, they bought themselves a pause period. But now 6 months into the pause period and no real trend in upward inflation has come to pass, the Fed will be forced to realize deflationary conditions and cut rates.”
To Cordoba’s point, the latest Wholesale Prices (PPI) validates the lack of inflation year-to-date and since mid-2018.
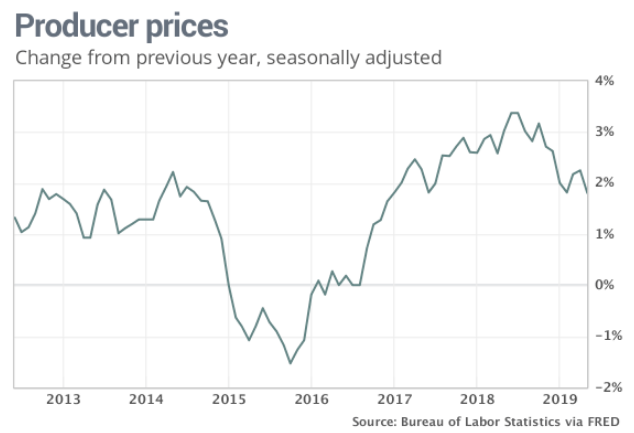
The producer price index edged up 0.1% last month, the government said Tuesday, matching the MarketWatch forecast. More notably, the increase in wholesale prices over the past year slowed to 1.8% from 2.2%, and they’re down sharply from a recent high of 3.1% last summer.
Tuesday morning, investors will receive even more data on inflation by way of the Consumer Price Index (CPI). To end the week, the consumer comes back into focus with monthly retail sales data. What may prove to impact the May retail sales are the lower gasoline prices since late May as well as the massive flooding in the Midwest which has proven a deterrent to consumer spending.
Reverting to our previous dialogue surrounding a near-term Fed rate cut, Goldman Sachs stands as one of the main outliers not forecasting a rate cut in 2019.
“Although it is a close call, we still expect the FOMC to keep the funds rate unchanged in the remainder of the year,” Jan Hatzius, the bank’s chief economist, said in a note on Monday. “In our view, this was not a strong hint of an upcoming cut but was simply meant to provide reassurance that the FOMC is well aware of the risks from the trade war.”
A speech from the Chair focused exclusively on longer-term issues at a time of sharply increased worries about trade policy might otherwise have come across as ‘out of touch’ to some market participants.”
But Goldman Sachs is a big institution and it also recognizes that what the market wants, it usually gets. I’ve definitely considered that question in my research activity over the course of the week at Finom Group (for whom I am employed). Recent notes from Goldman Sachs’ chief U.S. equity strategist David Kosten notes that since 1988, on 13 occasions the futures market expected a cut in the funds rate the day prior to a scheduled FOMC meeting. The Fed cut rates in all 13 instances. In other words, the Fed has always cut interest rates when the market priced a cut on the day prior to an FOMC meeting.
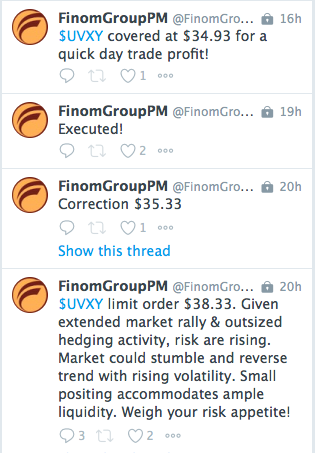
Given the wide range of views on the current state of the market coupled with Fed rate cuts going forward, it’s no wonder hedging activity has been prolific of late. How this is all resolved remains to be seen and supports my suggestive stance to remain positioned with cash and trading nimbly with defined parameters. Yesterday’s trade of the day remained within the Volatility complex and with a short trade issued on shares of UVXY as depicted below.