
VIX Has Been Making Higher Lows
- SPX Monitoring purposes; Covered short SPX 1/31/17 at 2278.87 =.09% gain; Short on 1/30/17 at 2280.90
- Monitoring purposes Gold: Sold GDX at 24.33 on 2/22/07 = gain 20.15%; Long GDX on 12/28/16 at 20.25.
- Long Term Trend monitor purposes: Short SPX on 1/13/16 at 1890.28
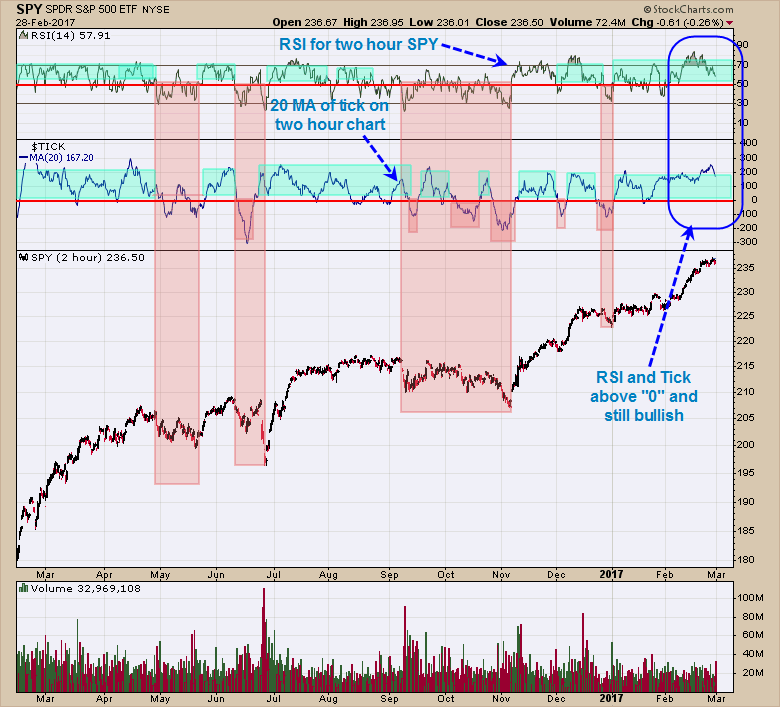
The above chart is a two hour chart for the SPY. The top window is the two hour RSI chart for the SPY and second from top window is the 20 period moving average of the tick. As long RSI stays above 50 and the 20 period moving average of the tick stays above “0” we have to say the short term trend for the SPY is up. The two hour chart for the RSI closed today at 57.91 and the 20 moving average of the tick closed at 167.20 and both in short term bullish levels. We will keep our powder dry for now.
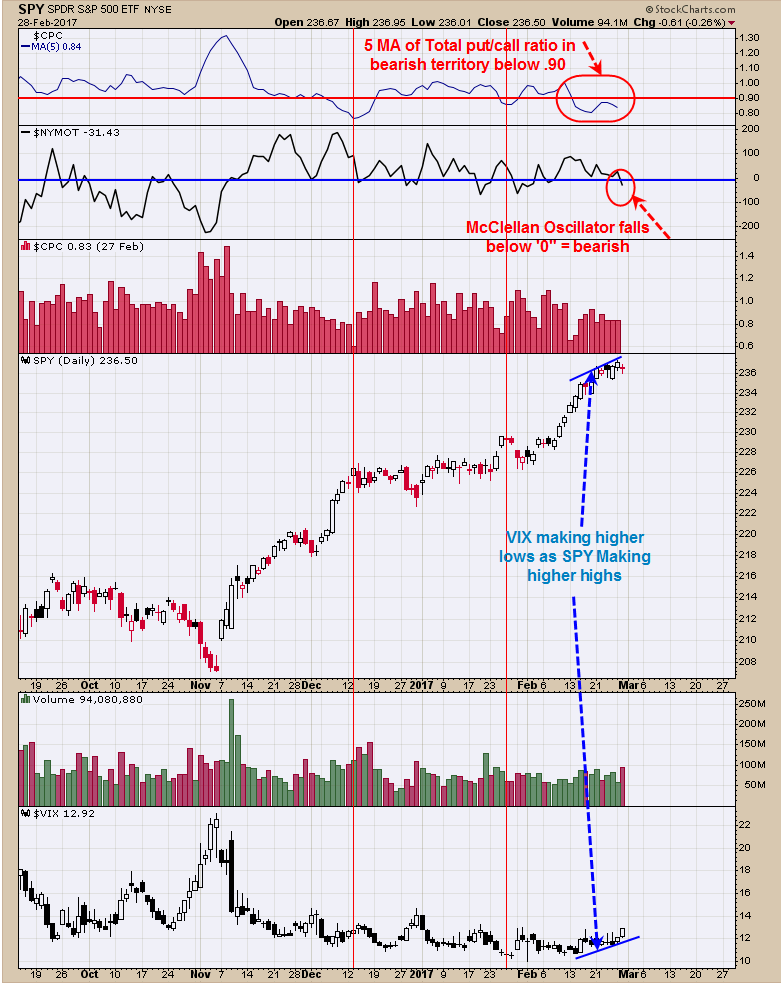
The top window is the 5 day average of the Total put/call ratio (CPC) and readings below.90 have appeared near market highs. The last several days the CPC 5 day average came in well below .90 and it appears market is starting to stall. Next window down is the McClellan Oscillator which closed below “0” at -31.43 and a bearish sign. The bottom window is the VIX which has been making higher lows as SPY was been making higher highs and a bearish combination. We expect at some point that SPY will pull back to support near 230 (2300 on SPX) before heading higher again. Normally the first decline off a top is not the “big one” but rather next rally up than second time down the decline is usually the worthwhile one. This churning by the SPY over the last week has produced bearish candlestick pattern called a “Doji” (not shown). The weekly RSI reached near 75 on the SPX. Going back to 2010 when the RSI reached near 75 and higher, the market stalled four of the last five times and two of them produced near a 10% correction and the other two where around 2%. The current development, if it plays out would appear to be near a 3% correction. Normally when the weekly RSI gets this high, it takes a while for a top to develop, so market could stay in the current range another week or two.
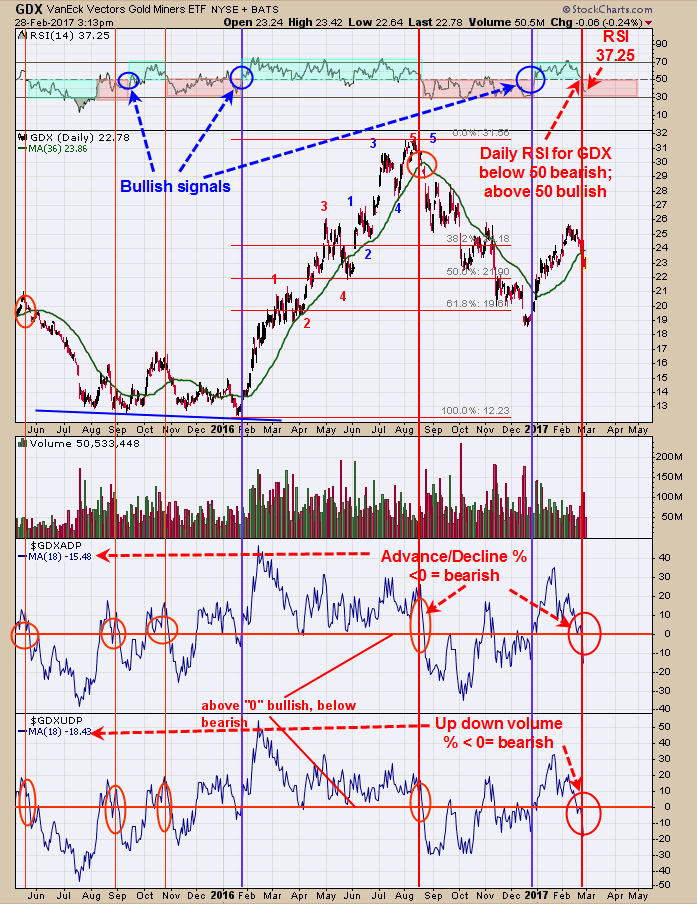
The top window is the RSI of the GDX. Bullish signals for GDX are generated when the RSI for GDX closes above 50 and bearish signals when it falls below 50. The current RSI reading is 37.25 and bearish. It will take an RSI reading above 50 to turn the trend back up. Adding to the short term bearish picture is the Advance/Decline % and Up down Volume %. When both of these indicators are below “0”, it’s a bearish sign for GDX and when above it a bullish sign. Today the Advance/Decline % closed at -15.48 and the Up down volume % closed at -18.43; both are bearish. On previous reports we had a possible downside target near 22.50 range. A more accurate way dealing with the next low would be for the RSI for GDX to close above 50 and the Advance/Decline % and Up down Volume % to close above “0”, what ever the price on GDX is at the time. Timer Digest has us ranked #2 in performance over the last 12 months. Sold GDX at 24.33 on 2/22/17 = gain 20.15%; Long GDX on 12/28/16 at 20.25.


Interesting and good analysis. Given the word is #Trump is trying to Democrat the Republicans into mass deficit spending the hopeful market will dream of fiscal stimulus on top of the absurd financial stimulus. So much for Trump deriding the Obama bubble. It seems like he wants to make an even greater one.
Thank you for the thoughts, So far market thinks #Trump is doing fine.
Thanks for sharing
Thanks for sharing
Thanks for sharing