
VIX Back To Normal? Not Really
The U.S. equities market had a wild start in 2020. Following the March 2020 sell-off, the S&P 500® posted its largest monthly gain (12.8%) since 1990. Meanwhile, VIX® went from its long-term median to an all-time high within a month before it settled around 30. One thing that has been debated lately is whether VIX, often referred to as the “fear gauge,” has gone back to normal and indicates that the market has hit the bottom. To answer this question, we need to investigate several aspects of VIX and its related trading activities.
VIX Futures Curve Not Completely Back to Contango
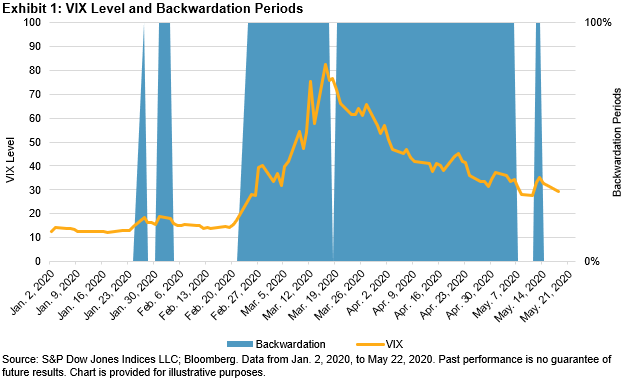
As pointed out in a recent VIX paper from the CFA Institute Research Foundation, the VIX futures curve is in contango about 80% of the time and usually goes into backwardation in distressed markets. On Feb. 24, 2020, the VIX futures curve flipped into backwardation, and it kept this downward sloping shape until May 6, 2020—the shaded area in Exhibit 1 shows the backwardation period of the VIX futures curve. However, the current price difference between the first- and second-month VIX futures is small, and the curve is more flat than upward sloping. In fact, the futures curve went back to mild backwardation on May 12 and May 13, 2020. This is unlike typical contango in VIX term structure.
VIX Level Remains Elevated
On Feb. 21, 2020, VIX closed at 17.08, near its long-term median of 17.27. In less than a month, it skyrocketed to an all-time high of 82.69. As of May 22, 2020, it was hovering around 30. Although this most recent level seems rather tame compared with its March peak, investors should understand that the current VIX readings are around its 90th percentile level of 28.7.
History has demonstrated that although volatility may rise rapidly, it often declines slowly. In other words, the market tends to remain volatile for a while after a shock occurs. A VIX level of 30 implies annualized volatility of 30% or daily moves of 1.9% in the market during the next 30 days. Given that the S&P 500 has moved about 0.76% daily on average since 1990, the current VIX level implies that investors collectively anticipate outsized daily moves, at least in the short term.
VIX Derivatives Trading Volume
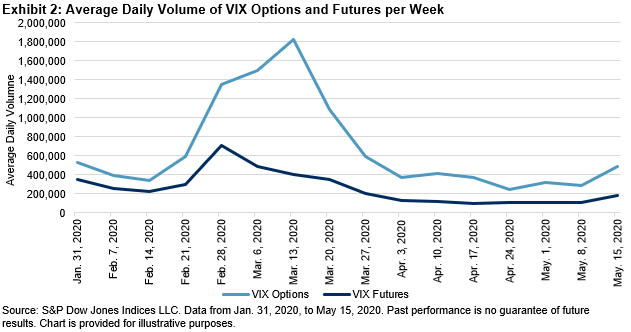
Derivatives trading on VIX dropped from its March peak, but it picked up again during the week of May 15, 2020. VIX options’ average daily volume (ADV) during the week of May 15 was only a quarter of the ADV during the week of March 13; however, it almost doubled the ADV from the week of April 24. The pickup in trading volume was accompanied by a jump in VIX levels and futures prices, indicating that investors were pricing elevated risk into June 2020 contracts. This is not surprising given that many states were positioned to reopen their economies after May 15, 2020.
Conclusion
It is yet to be seen whether reopening the U.S. economy will fuel a resurgence of COVID-19 cases. On top of that, President Trump’s statement to cut ties with the second-largest economy in the world cast an additional shadow over the market outlook. The VIX levels, futures curve, and trading activities seem to tell us that, despite the improved optimism in the market, elevated risk is likely to be the new norm, at least for a short while.
Disclaimer: For more information on the risk-adjusted performance of actively managed funds compared with their benchmarks in 2018, read our latest more


