
VC Spending Hit An All-Time High In 2018 Thanks To Tech Bubble 2.0
CNBC just published a piece about how venture capital spending hit an all-time high in 2018, surpassing the dotcom bubble record:
Venture capital just had its highest spending year in history.
The amount of money firms spent on private companies hit a new all-time record in 2018— well above the previous watermark from the dotcom boom.
Last year, venture capital firms spread roughly $131 billion across 8,949 deals, according to data published by Pitchbook and the National Venture Capital Association Thursday. The previous record was a $100 million total notched in the year 2000.
Although the dollar amount jumped by more than 57 percent from $83 billion last year, the number of deals went down. Deal count fell by about 5 percent this year from a roughly 9,400 total last year.
Cameron Stanfill, Pitchbook venture analyst who co-authored the report, said sky-high price tags for start-ups accounted for the new record total despite having fewer deals.
“There is a lot of money competing for a finite amount of companies, and that’s pushing prices up,” Stanfill told CNBC in a phone interview.
Though most people look at record VC spending as a sign of a strong, healthy economy, my research has found that the current VC boom is the result of another tech bubble that inflated due to the Federal Reserves ultra-stimulative monetary policies of the past decade (read my recent article about this). Unfortunately, this tech bubble is going to end just like the late-1990s dot-com bubble did – in another disastrous bust.
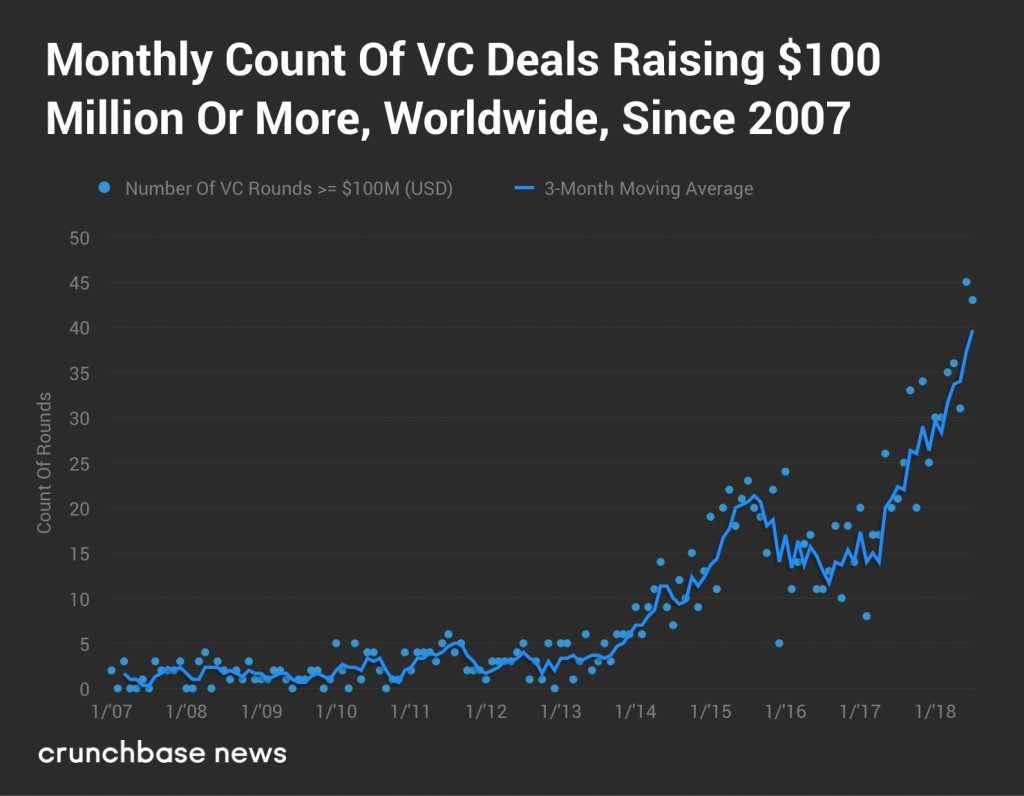
The chart below shows the monthly count of global VC deals that raised $100 million or more since 2007. According to this chart, a new “unicorn” startup was born every four days in 2018.
(Click on image to enlarge)
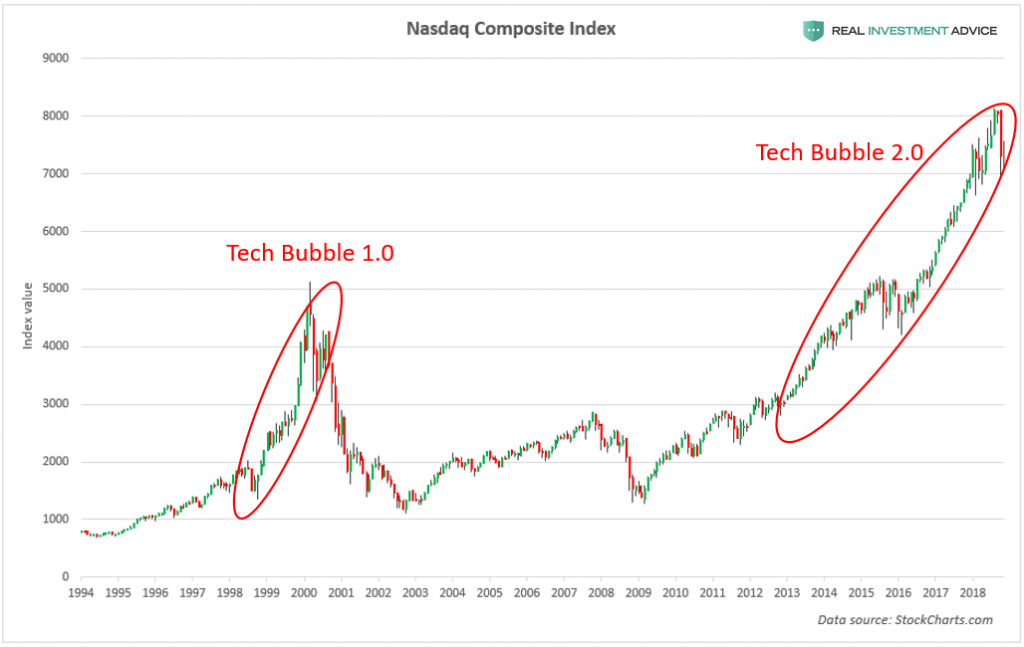
The chart below shows the Nasdaq Composite Index and the two bubbles that formed in it in the past two decades. Lofty tech stock prices and valuations encourage the tech startup bubble because publicly traded tech companies have more buying power with which to acquire tech startups and because they allow startups to IPO at very high valuations.
(Click on image to enlarge)
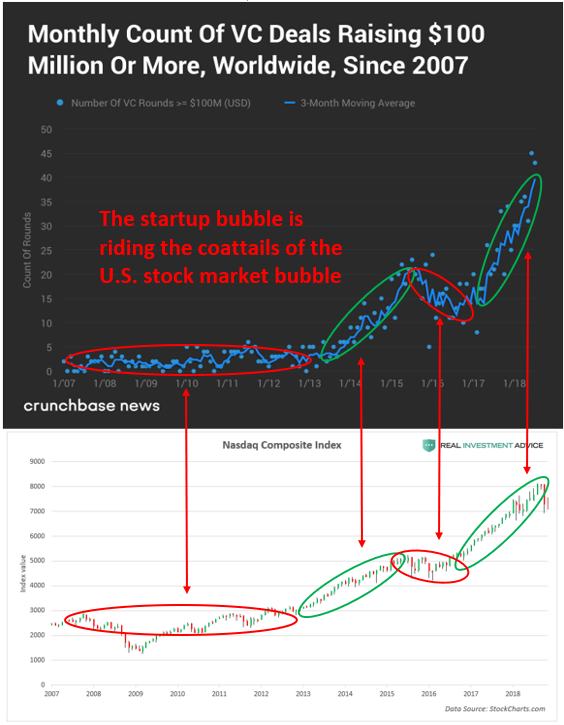
In the chart below, I compared the monthly global VC deals chart to the Nasdaq Composite Index and they line up perfectly. Surges in the Nasdaq lead to surges in VC deals, while lulls or declines in the Nasdaq lead to lulls or declines in VC deals.
(Click on image to enlarge)
For the author's full disclosure policy, click here.


