
Valuations Back Up As Brexit Panic Fades
We now calculate that 46% of the stocks we can assign a valuation are overvalued and 15.47% of those stocks are overvalued by 20% or more. These numbers have increased-- slightly-- since we published our valuation study in June-- when the overvaluation was at 40%. That last study was published just a week before the Brexit vote.
Think back to the panic we saw soon after moment, with the doomsayers screaming that investors should SELL SELL SELL! Yet another illustration of the point that selling in the midst of crisis is typically the worst possible response for the long-term investor. At this point, that blip looks like little more than "noise." So, those who sold in the midst of that Brexit-induced panic locked in their losses.
And the markets in the US and elsewhere certainly shook off that Brexit panic, with several indices setting new records over the past few weeks. Many analysts found that the uncertainty in the EU removed any possible scenario where the Fed would raise rates any time soon. As always, that sort of sentiment provided a boost to equities.
Of course, that is not to say that some Fed officials don't favor increases, but the time to hit the brakes may have passed by given the fact that the US is in the midst of a presidential election, and the central bank is notoriously skittish about any hint of political bias.
We won't have a better sense of potential rate increases until after the next round of meetings later this month. If good data for the US and world economy holds up, the Fed may push for an increase in September. But again, we find that the labor market should still be given some room to run. As always, and as we repeat like a mantra, the balancing act between the dual mandate of control inflation and foster full employment creates tension.
For now, our valuation figures still show a "normal" market, with valuations nowhere near that bargain level they presented in the immediate aftermath of the Brexit vote.
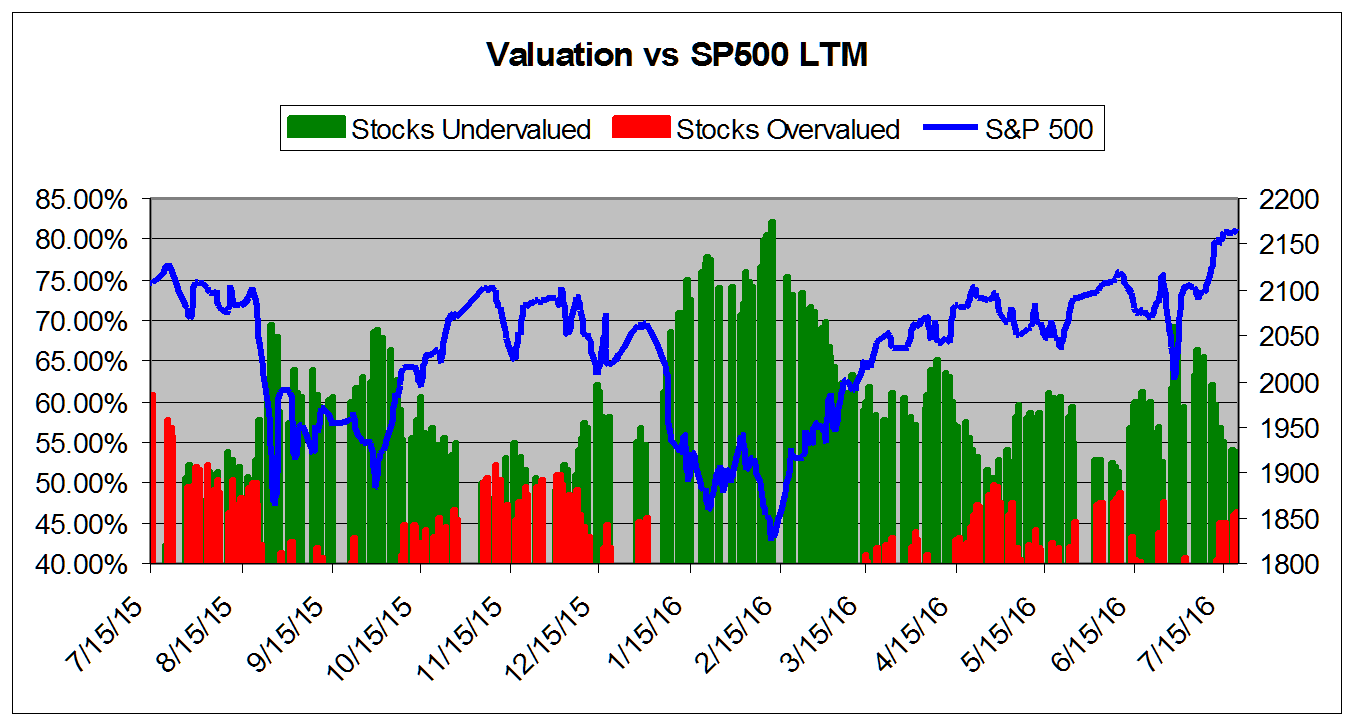
The chart below tracks the valuation metrics from July 2015. It shows levels in excess of 40%.
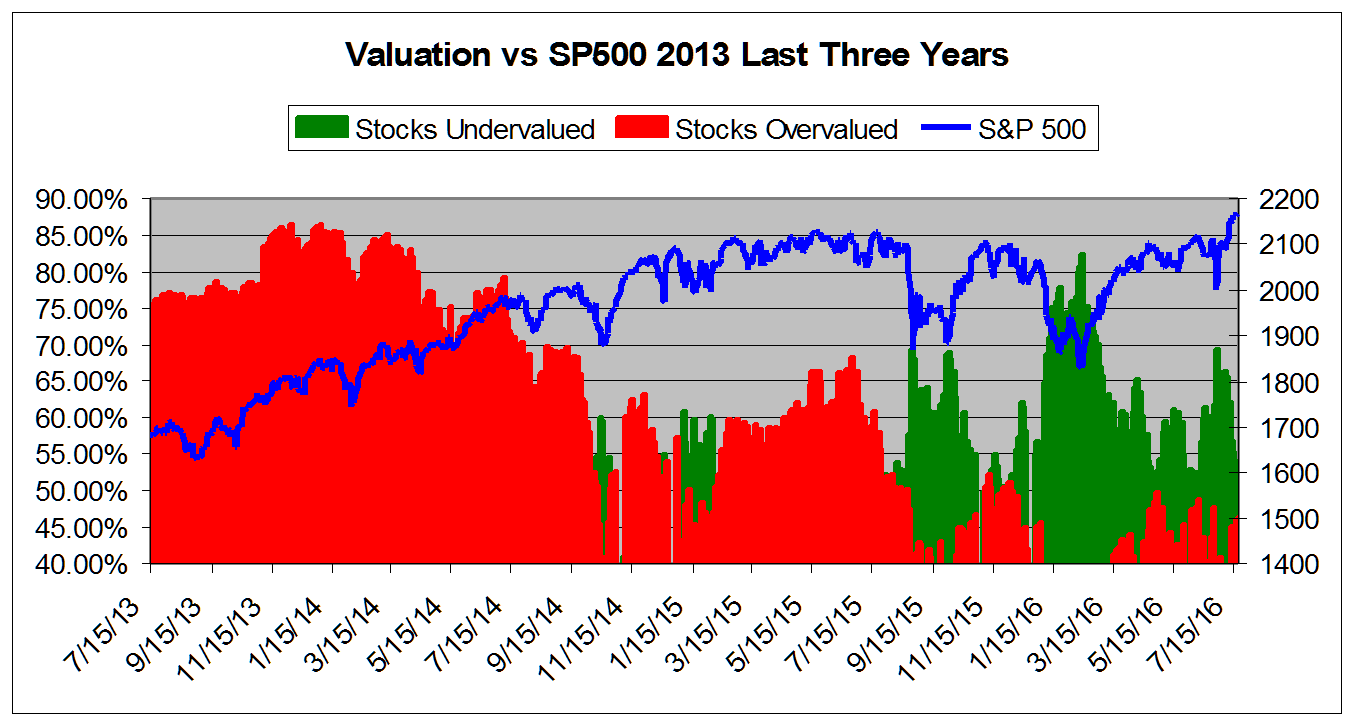
This chart shows overall universe over valuation in excess of 40% vs the S&P 500 from July 2013
This chart shows overall universe under and over valuation in excess of 40% vs the S&P 500 from March 2007*
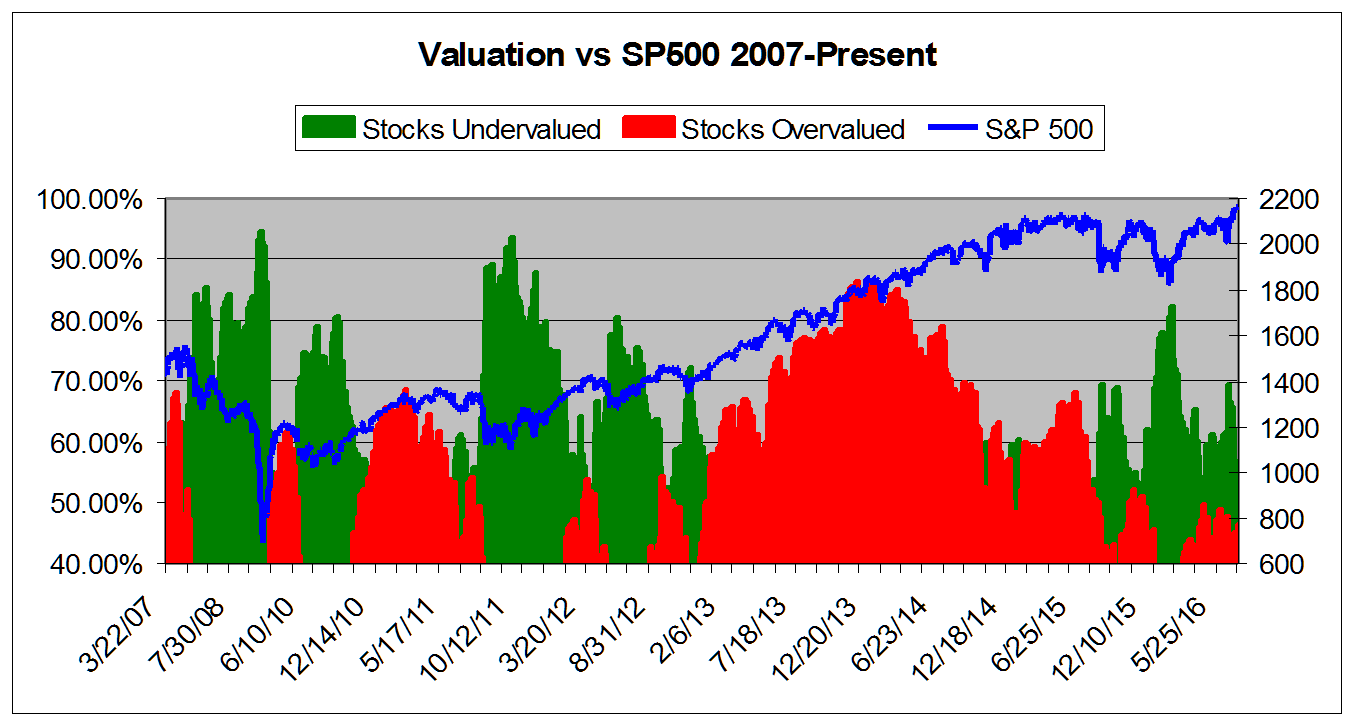
*NOTE: Time Scale Compressed Prior to 2011.
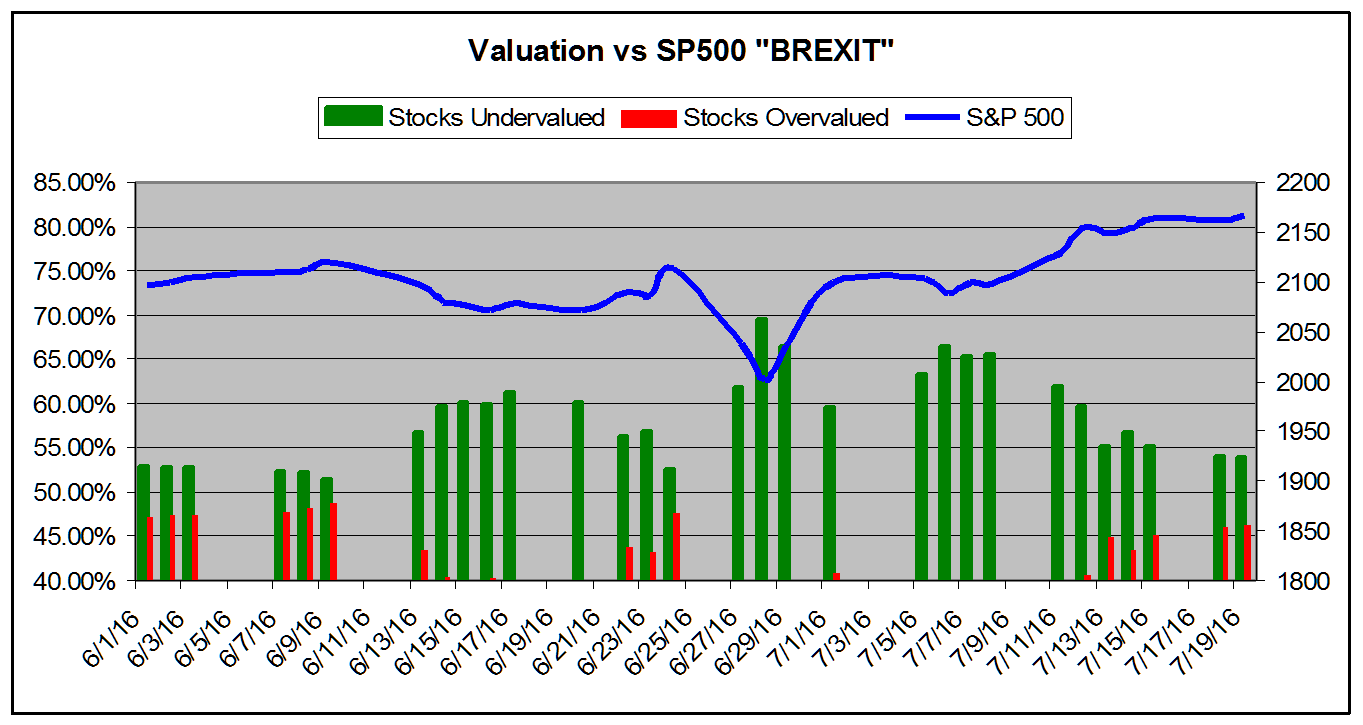
The chart below tracks the valuation metrics for June and July, 2016. It encompasses the Brexit sell off. It shows levels in excess of 40%.
Market Overview
|
Summary of VE Stock Universe |
|
|
Stocks Undervalued |
53.73% |
|
Stocks Overvalued |
46.27% |
|
Stocks Undervalued by 20% |
22.67% |
|
Stocks Overvalued by 20% |
15.47% |
Sector Overview
|
Sector |
Change |
MTD |
YTD |
Valuation |
Last 12-MReturn |
P/E Ratio |
|
Basic Materials |
-0.08% |
8.28% |
50.85% |
18.22% overvalued |
45.71% |
31.53 |
|
Consumer Staples |
0.26% |
2.85% |
10.35% |
8.54% overvalued |
5.45% |
24.50 |
|
Utilities |
-0.36% |
3.04% |
14.00% |
7.13% overvalued |
9.20% |
23.63 |
|
Multi-Sector Conglomerates |
0.03% |
2.26% |
6.69% |
6.44% overvalued |
-6.42% |
18.78 |
|
Industrial Products |
0.01% |
4.85% |
10.51% |
2.43% overvalued |
-1.55% |
22.62 |
|
Business Services |
0.17% |
3.47% |
14.37% |
0.15% overvalued |
-7.07% |
23.60 |
|
Construction |
0.80% |
5.16% |
26.58% |
0.09% overvalued |
2.87% |
22.26 |
|
Oils-Energy |
0.57% |
1.71% |
18.40% |
1.04% undervalued |
-21.17% |
24.17 |
|
Aerospace |
-0.00% |
2.45% |
-2.65% |
1.57% undervalued |
-4.40% |
19.07 |
|
Computer and Technology |
0.33% |
4.03% |
9.62% |
1.71% undervalued |
-2.34% |
29.79 |
|
Finance |
0.17% |
3.25% |
4.55% |
1.90% undervalued |
-2.25% |
16.25 |
|
Consumer Discretionary |
0.43% |
4.25% |
6.52% |
2.41% undervalued |
-8.03% |
21.78 |
|
Transportation |
0.20% |
6.56% |
7.26% |
7.98% undervalued |
-24.37% |
14.21 |
|
Retail-Wholesale |
0.56% |
3.39% |
-0.15% |
8.68% undervalued |
-9.38% |
22.14 |
|
Medical |
0.15% |
4.53% |
-0.34% |
10.18% undervalued |
-23.99% |
27.71 |
|
Auto-Tires-Trucks |
0.16% |
4.63% |
1.88% |
16.25% undervalued |
-11.11% |
12.52 |
Valuation Watch: Overvalued stocks now make up 46.27% of our stocks assigned a valuation and 15.47% of those equities are calculated to be overvalued by 20% or more. Seven sectors are calculated to be overvalued.
Disclosure: None.
Disclaimer: ValuEngine.com is an independent research provider, producing buy/hold/sell recommendations, ...
more

