
USDX: The Cleanest Shirt Among The Dirty Laundry
The precious metals seem to be ready for vacation deep dives, but all signs indicate that the USDX will stay on the side of the pool, perfectly dry.

Image Source: Pexels
The USD Index (USDX)
With the USD Index washing away its sins in recent weeks, the greenback has recorded five daily rallies of more than 0.40% since May 26. And with the up days growing stronger and the down days growing weaker, the change in the trend will be clear to more and more traders, which eventually would likely cause a shift in the sentiment. Case in point: while gold, silver and mining stocks are looking forward to their summer vacations (deep dives seem to be in the vacation plans, especially given today’s pre-market ~$20 decline in gold), the USD Index has been hard at work rehabbing its reputation. And with the U.S. dollar easily the cleanest shirt among the currency basket of dirty laundry, the smell of fresh linen has begun to pique investors’ interest.
For one, not only are the USD Index’s fundamentals trending up, but the technicals are also moving in the same direction. And after the USD Index closed visibly above its previous weekly close, the greenback’s verified breakout above its declining resistance line remains a source of optimism. Moreover, while the USD Index still remains below its dashed rising resistance line and its 50-day moving average, subtle signs signal that the dollar is slowly cleaning up its act.
Please see below:
Second, while the USD Index’s rally occurred slowly at first in 2016, the momentum gathered steam as sentiment shifted. And while we’re only in the first stage of the two-stage process, it’s important to remember that investors are forward-looking.
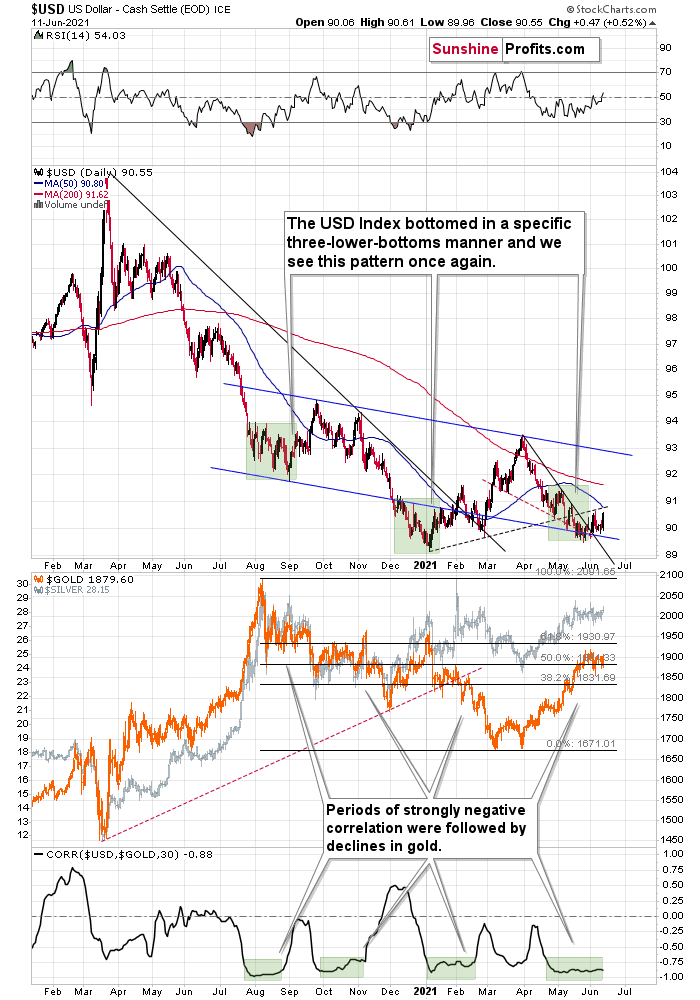
Third, the USD Index recently bounced off of a triple (declining) bottom and prior instances were followed by significant rallies (the identical patterns formed in mid-and-late 2020 and are marked by the shaded green boxes above). During that time, the USD Index originally declined steadily before zigzag corrections culminated with new lows. However, with the third time being a charm, the third distinctive bottom was the final one.
For context, the USDX sunk like a stone in July 2020, before moving back and forth while still declining in August. Similarly, in November 2020, the USDX fell from grace once again (there was one exception) before moving back and forth while still declining in December. More importantly, though, ever since the final days of March, we’ve seen the same thing all over again. After the USD Index lost its confidence in April, we saw back-and-forth movement with lower lows and lower highs in May. However, with the third distinctive low likely already achieved, the USD Index’s best days may lie ahead.
Head & Shoulders Patterns Ahead
And what happened to gold, silver and mining stocks in the time of the two previous analogues?
Well, in August, gold topped without waiting for USD’s final bottom – which is natural, given how extremely overbought it was at the time. Likewise, in early January gold topped (which was much more similar to the current situation given the preceding price action) when the USDX formed its third and final distinctive bottom.
In addition, while the development is more of a wildcard at the moment, the USD Index might be in the early innings of forming an inverted head & shoulders pattern. For context, an inverted H&S pattern is a bullish development that if formed, could usher the USD Index to about 97-98. However, completing the right shoulder requires an upward breach of 93 (the blue line on the chart above), so at this point, it’s more of an indication than a confirmation.
However, if we turn the pattern upside down, the Euro Index might be in the midst of forming a bearish H&S pattern. If you analyze the right side of the chart below, you can see that the symmetrical pattern has the current price action mirroring the summer of 2020. And while we’re still in the early innings of forming the right shoulder, three peaks were recorded during the second half of 2020 before the Euro Index eventually rolled over. Likewise, with a symmetrical setup that seems to already be in motion, the Euro Index may be heading down a similar path of historical ruin. In the second half of 2020, the decline was not that big, but it’s no wonder that this was the case as that was only the left shoulder of the pattern. Completion of the right shoulder, however, would imply another move lower, at least equal to the size of the head – to about the June 2020 lows or lower.
Please see below:
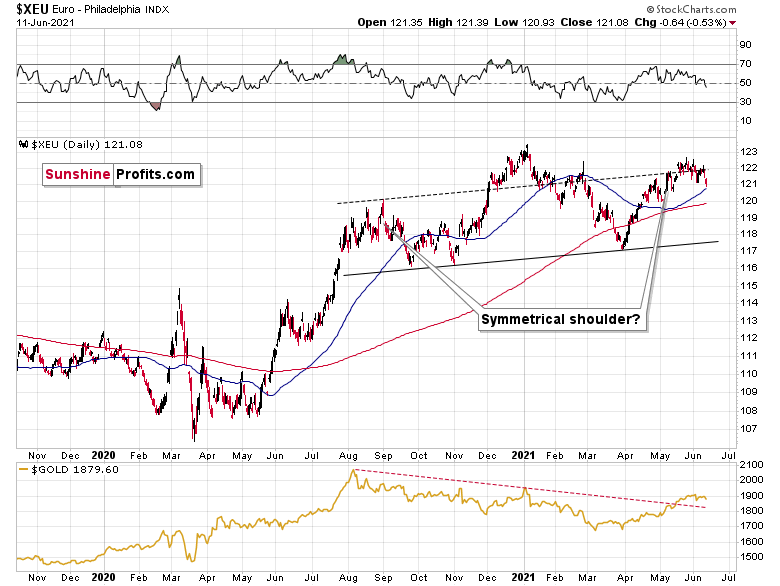
Moreover, with the USD Index’s triple bottom mirrored by a likely triple top in the Euro Index, last week’s decline actually ushered the Euro Index materially below the dashed resistance line of its monthly channel. And with the price action mirroring what we witnessed in mid-to-late 2020 – right before the Euro Index plunged – investors’ confidence could soon turn into fear.
Furthermore, the completion of the masterpiece could have a profound impact on gold, silver and mining stocks. To explain, gold continues to underperform the euro. If you analyze the bottom half of the chart above, you can see that material upswings in the Euro Index have resulted in diminishing marginal returns for the yellow metal. Thus, the relative weakness is an ominous sign, and if the Euro Index reverses, it could weigh heavily on the precious metals over the medium term. That’s another point for the bearish price prediction for gold.
The 2016 Analogue
Also, foretelling another revival, the USD Index has hopped into the time machine and set the dial to 2016. With the flashback scrubbing the stains off of the USD Index’s 2016 downswing, Mr. Clean could be arriving at just the right time.
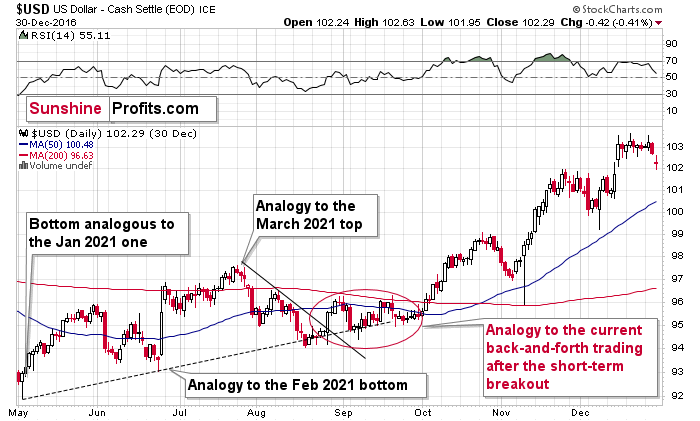
As you can see on the above chart, what we saw this year is quite similar to what happened in 2016. If the analogy continues, the back-and-forth trading is likely to be followed by an upward acceleration. The trigger for it could be the rally back above the 50-day moving average and the rising dashed line. The confirmed breakout above both in 2016 resulted in sharper rallies in the USDX and much lower gold prices (gold declined about $200 between early October 2016 and its December 2016 lows).
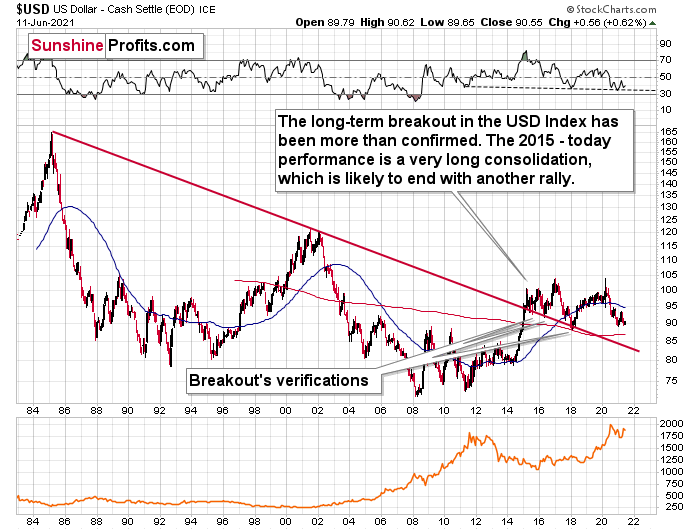
Finally, the USD Index’s long-term breakout also remains intact. And when we steady the binoculars and observe the currency landscape, the greenback’s recent weakness is largely inconsequential.
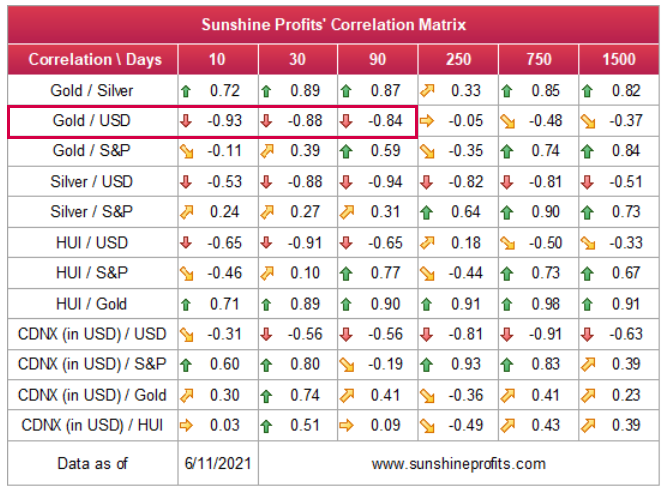
Also, please note that the correlation between the USD Index and gold is now strongly negative (-0.93 over the last 10 days). The same thing happened in early January 2021 and in late July – August 2020; these were major tops in gold.
The bottom line?
Once the momentum unfolds, ~94.5 is likely the USD Index’s first stop. In the months to follow, the USDX will likely exceed 100 at some point over the medium or long term. Keep in mind though: we’re not bullish on the greenback because of the U.S.’ absolute outperformance. It’s because the region is outperforming the Eurozone and the EUR/USD accounts for nearly 58% of the movement of the USD Index – the relative performance is what really matters.
In conclusion, investors are well aware of the USD Index’s dirty laundry, and the euro’s squeaky-clean image is starting to show stains. Moreover, with the U.S. Federal Reserve (FED) poised to come clean and scale back its asset purchases in September, the USD Index should shine over the medium term. More importantly, though, with gold, silver and mining stocks exhibiting strong negative relationships with the U.S. dollar, the greenback’s eventual shower could send all of the precious metals’ gains down the drain.
Disclaimer: All essays, research and information found on the Website represent the analyses and opinions of Mr. Radomski and Sunshine Profits' associates only. As such, it may prove wrong ...
more

