
USD/TRY Price Analysis: Approaching Key Support, Deeper Losses Eyed
USD/TRY is seeing a six-day losing steak this Thursday, in a sustained correction from record highs of 8.8049 reached on June 2 after Turkey’s President Tayyip Erdogan spoke to the central bank governor about lowering interest rates in the next two months.
Photo by Omid Armin on Unsplash
The spot ignores broadly firmer US dollar and Treasury yields, as the corrective decline remains at full swing. More downside remains in the offing, as depicted by USD/TRY’s four-hour technical chart.
The steady decline in the pair from all-time highs has carved out a falling wedge formation, with the price heading towards the lower boundary of the pattern.
At the time of writing, the spot is down about 0.50% on the day, testing multi-day lows just ahead of the 100-simple moving average (SMA) at 8.5249.
A breach of the latter could threaten the wedge support at 8.5138. The Relative Strength Index (RSI) continues to head closer towards the oversold territory, now at 32.10, leaving room for more downside.
The next relevant support area is seen at 8.47, the horizontal trendline in orange.
A bear cross, represented by the 21-SMA cutting through the 50-SMA from above, adds credence to a potential move lower.
USD/TRY: Four-hour chart
(Click on image to enlarge)
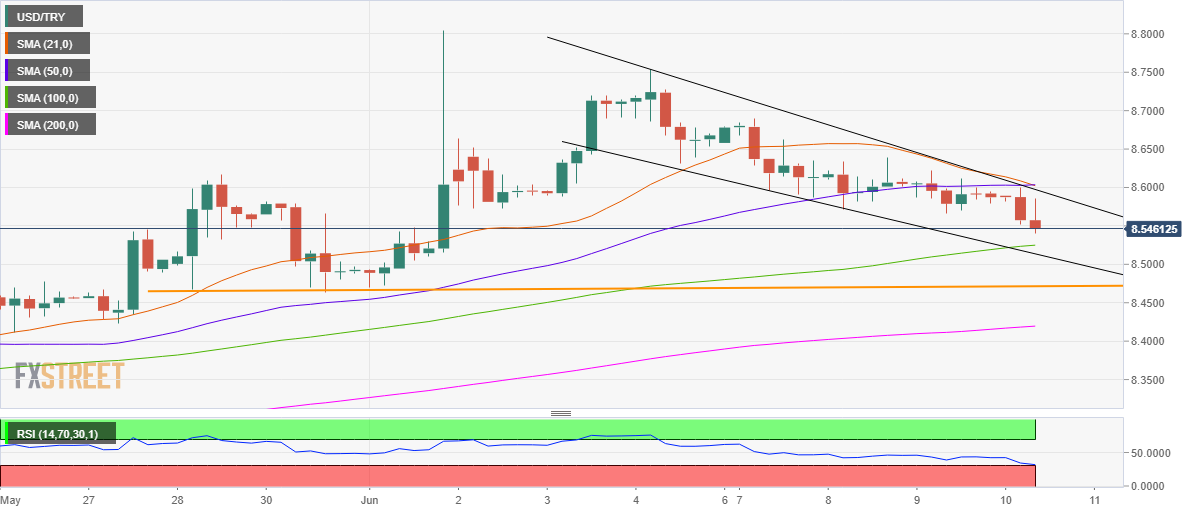
Alternatively, the confluence of the 21 and 50-SMAs at 8.6020 will act as a strong resistance, where the falling wedge hurdle also coincides.
Further up, buyers would look to test the June 7 high of 8.6902.
Disclaimer: Information on these pages contains forward-looking statements that involve risks and uncertainties. Markets and instruments profiled on this page are for informational purposes only ...
more

