
USD/JPY Weekly Price Outlook: Levels To Know After The ’Flash Crash’
In this series, we scale-back and look at the broader technical picture to gain a bit more perspective on where we are in trend. The US Dollar has seemingly collapsed against the Japanese Yen with price plummeting more than 8.6% of the October highs before rebounding sharply this week. Here are the key targets & invalidation levels that matter on the USD/JPY weekly chart into the start of the year.
USD/JPY WEEKLY PRICE CHART (LOG)
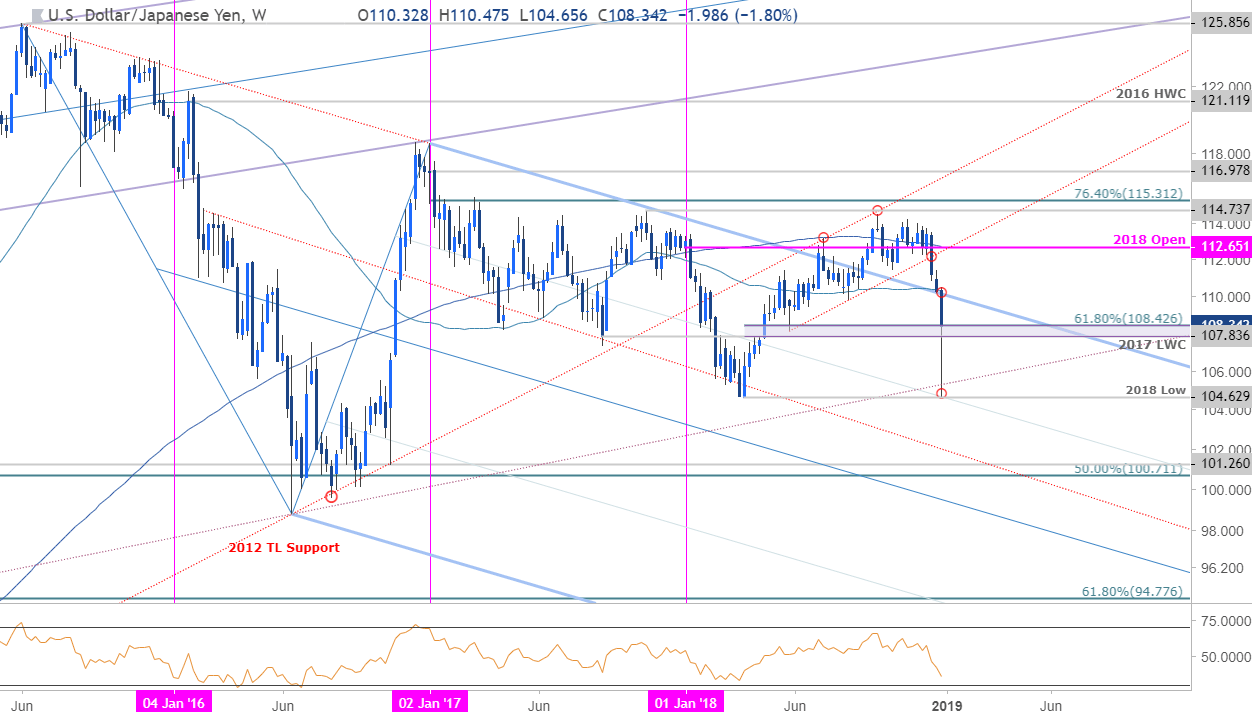
Notes: USD/JPY has nearly covered the entire 2018 range in just the past five weeks with price turning just pips from the yearly lows into the open of January trade. A sharp 3.6% rally off the weekly low takes the pair back within the confines of a key pivot zone at 107.83-108.42 – a region defined by the 2017 low-week close and the 61.8% retracement of the 2018 range. This threshold has offered some major price inflections over the past few years and a close below would be needed to keep the immediate short-bias viable.
Note that price is poised to register the largest single-week average true range since 2016- there were four instances of weekly ranges equal-to-or-exceeding this extreme that year with three of the four registering key lows in price that held for weeks. This doesn’t mean price is going to rebound, but it does highlight the risk for some consolidation if USD/JPY can stabilize above this key support zone.
Initial resistance stands at the 2015 pitchfork which converges on the 52-week moving average around 110.30s with critical resistance / broader bearish invalidation at ~112.65- a region defined by the 2018 yearly open and the 200-week moving average. A break below 104.63 exposes subsequent support objectives at the lower parallel (red) around the 102-handle backed by 1999 low at 101.26 and the 50% retracement of the 2011 advance at 100.71.
Bottom line: The immediate focus is on a reaction off the 107.83-108.42 pivot zone for guidance with the broader risk-weighted to the downside while blow 110.30. From a trading standpoint, there’s not much to do here just yet, but we’ll be on the lookout for possible near-term exhaustion if price manages to hold above 107.83. Ultimately, a recovery may offer more favorable entries for another attempt to break lower.
USD/JPY TRADER SENTIMENT
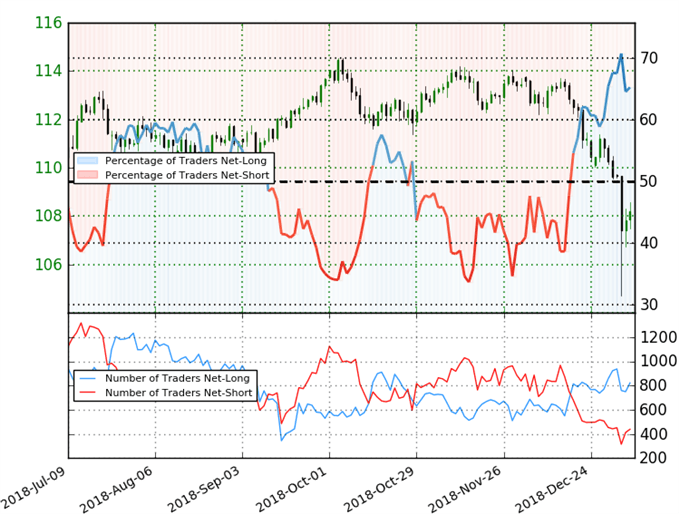
- A summary of IG Client Sentiment shows traders are net-long USD/JPY - the ratio stands at +1.88 (65.3% of traders are long) – bearish reading
- Traders have remained net-long since December 18th; price has moved 4.0% lower since then
- Long positions are 10.4% higher than yesterday and 0.5% higher from last week
- Short positions are 21.8% higher than yesterday and 12.1% lower from last week
- We typically take a contrarian view to crowd sentiment, and the fact traders are net-long suggests USD/JPY prices may continue to fall. Yet, traders are less net-long than yesterday but more net-long from last week and the combination of current positioning and recent changes gives us a further mixed USD/JPY trading bias from a sentiment standpoint.
Disclosure: Do you want to see how retail traders are currently trading the US Dollar? Check out our IG Client Sentiment ...
more

