
USDJPY To Fresh 2019 Highs As EURUSD Tests Below 1.1300
US DOLLAR BULLS REMAIN IN DRIVER SEAT
The US Dollar has opened this week’s trade by continuing the bullish trend that started around the late-January FOMC rate decision. That meeting took place on the Wednesday before last, and since then Dollar bulls have taken control of near-term price action in the currency to push up to fresh monthly highs, eclipsing the 96.68 level that held the bullish advance in the latter portion of last week. Ahead on the chart, the 97.00 looms large and a test above this zone would constitute a fresh 2019 high.
US DOLLAR EIGHT-HOUR PRICE CHART
(Click on image to enlarge)
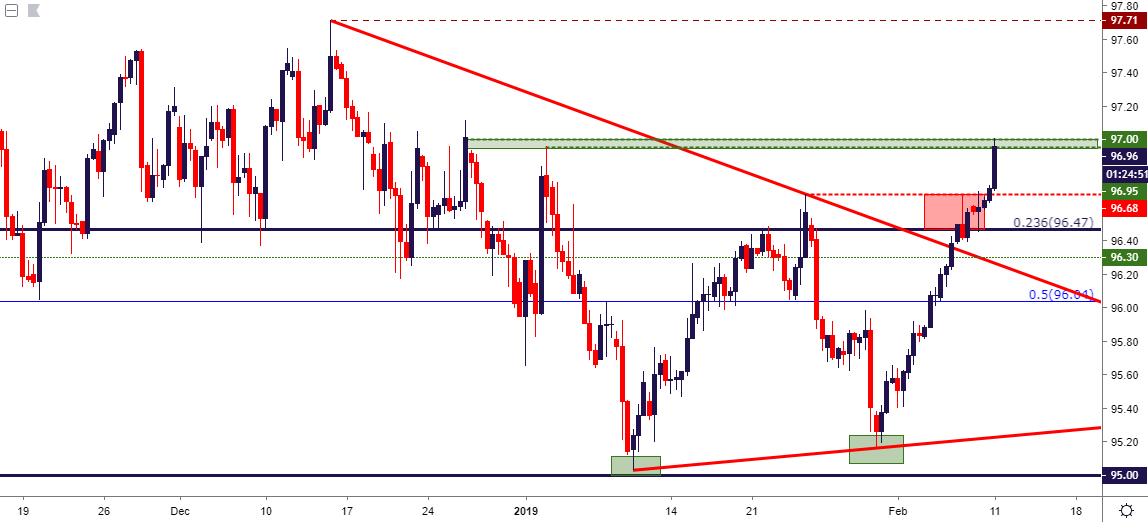
Chart prepared by James Stanley
On this week’s economic calendar, the potential exists for continued USD volatility, as a slew of Fed speakers are set to give commentary each day of this week; and on the data front, US CPI is released on Wednesday, Advance Retail Sales is due on Thursday morning and U of Mich Consumer Sentiment is unveiled on Friday morning.
USD: FED-SPEAK FOR THIS WEEK (TIMES IN EASTERN)
(Click on image to enlarge)

Chart prepared by James Stanley
EUR/USD RIDES SHORT-TERM TREND INTO RANGE SUPPORT
For much of the past three months, EUR/USD has been exhibiting back-and-forth price action. Resistance has held for much of the period in a zone that runs from 1.1448-1.1500 while support has shown at a series of higher lows from 1.1200-1.1300.
But, over the past week and change, as the US Dollar strength has become more pronounced, EUR/USD has dropped lower with an impressive degree of consistency. On the hourly chart below, a bearish trend-line has been added to highlight this theme.
EUR/USD HOURLY PRICE CHART
(Click on image to enlarge)
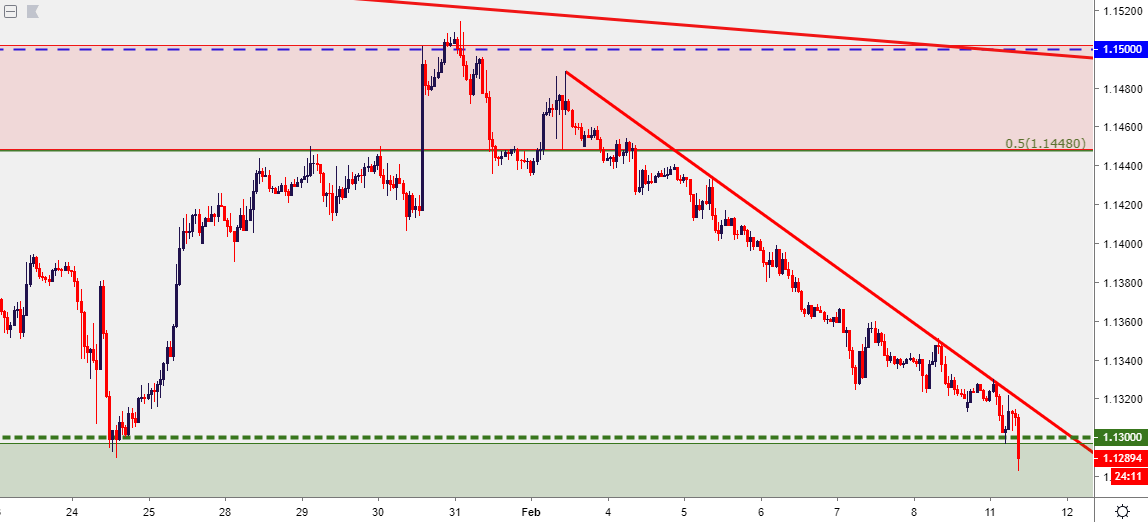
Chart prepared by James Stanley
The big question at this point around EUR/USD is whether sellers can retain control as longer-term support has come into the equation. Since the bearish trend in the pair stalled-out in November, there have been numerous attempts from sellers to leave this zone behind, most recently a couple of weeks ago. But each has thus far failed, and that can make the prospect of chasing this move in the early portion of this week as a challenging item.
EUR/USD EIGHT-HOUR PRICE CHART
(Click on image to enlarge)
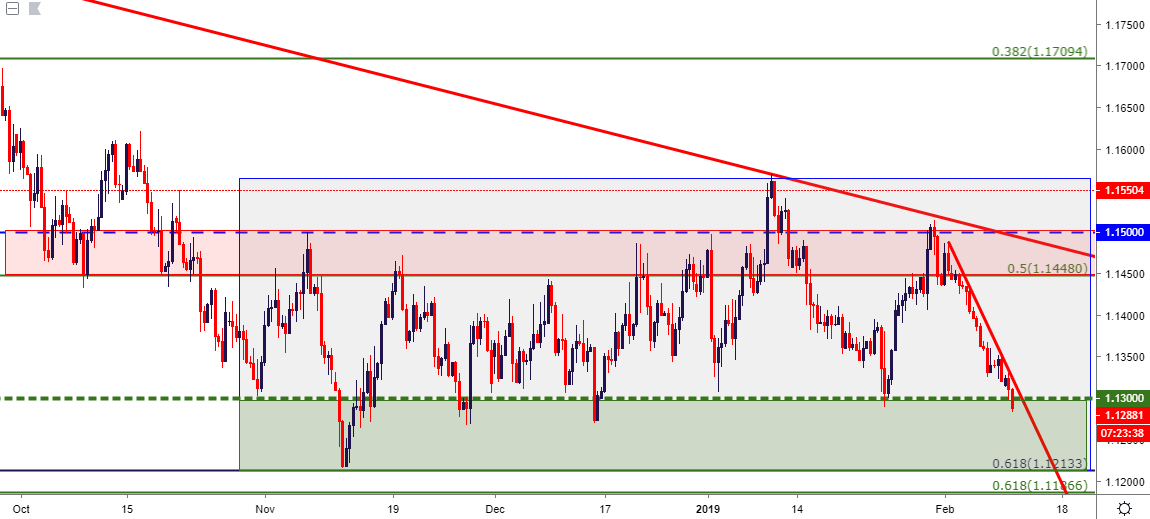
Chart prepared by James Stanley
USD/JPY TRADES ABOVE KEY 110.00 LEVEL, BREAKS OUT TO FRESH 2019 HIGH
Going along with that US Dollar strength has been a topside push in USD/JPY as the pair is now trading at fresh 2019 highs. The 110.00 level had provided numerous instances of resistance over the past few weeks as the pair recovered from the early-year surge of Yen-strength.
USD/JPY FOUR-HOUR PRICE CHART
(Click on image to enlarge)
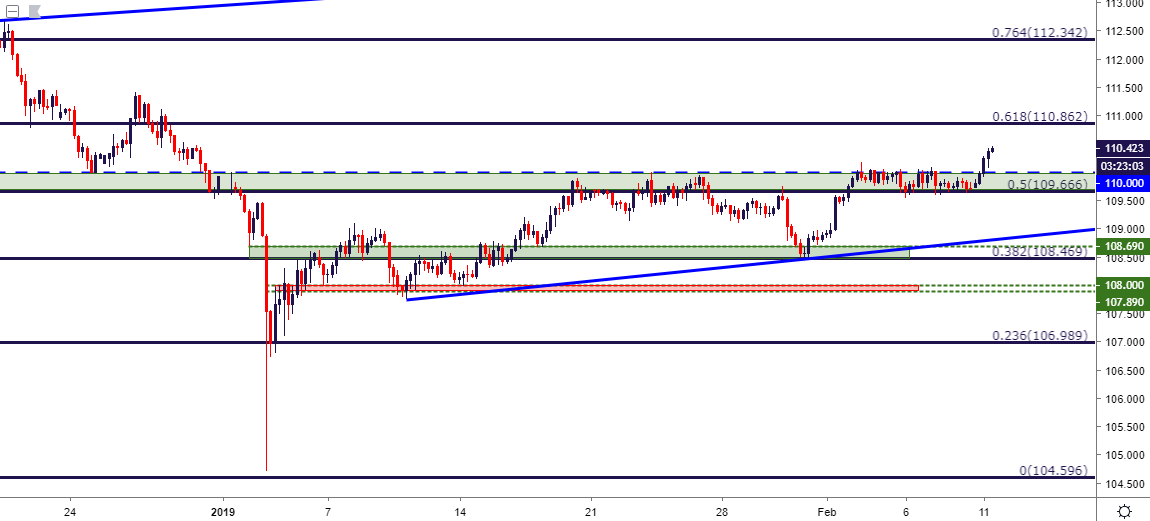
Chart prepared by James Stanley
USD/CAD TESTS HIGHER-LOW SUPPORT AFTER LAST WEEK’S BOUNCE
USD/CAD had a strong outing last week, and this comes after setting a fresh two-month low on the first day of February. Sliding Oil prices contributed to last week’s move, but the Friday jobs report out of Canada brought a quick run of CAD-strength to push USD/CAD down to a key zone of prior support that runs from 1.3236-1.3259. A hold of this support can open the door for a re-test of resistance at 1.3325 and the zone that runs from 1.3361-1.3385. On the other hand, should that 1.3325 resistance hold, the door remains open for another push lower, looking for a re-test of the February low that takes place around the 1.3066 Fibonacci level.
USD/CAD FOUR-HOUR PRICE CHART
(Click on image to enlarge)
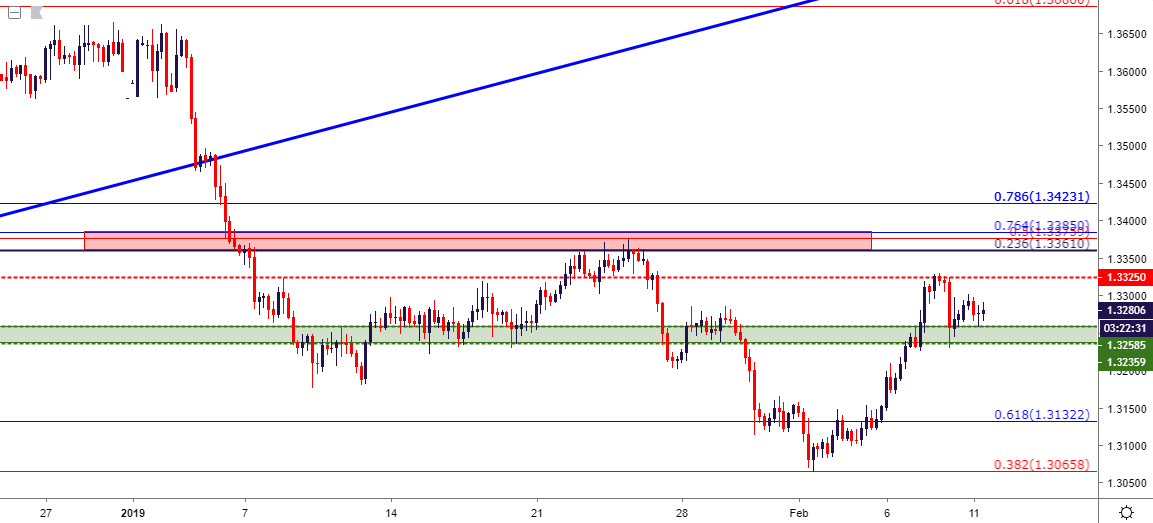
Chart prepared by James Stanley


