
USD/JPY Rate Tracks Rebound In US Yields Ahead Of Fed Rate Decision
USD/JPY appears to be tracking the recovery in US yields as it extends the advance from the monthly low (109.06) to trade back above the 50-Day SMA (109.98), and a further improvement in risk appetite may keep the exchange rate afloat as Fed officials brace for a transitory rise in inflation.
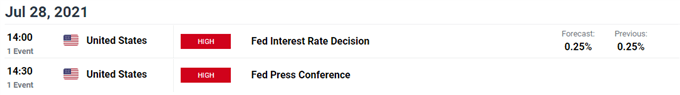
It seems as though the FOMC will take a gradual approach in scaling back its emergency measures as Chairman Powell tells US lawmakers that the central bank will “provide notice well in advance of an announcement to reduce the pace of purchases,” and the committee may merely attempt to buy time ahead of the quarterly meeting in September as “the Committee's standard of substantial further progress was generally seen as not having yet been met.”
As a result, more of the same from the FOMC may undermine the recent rebound in USD/JPY as its likely to drag on Treasury yields, but a material change in the forward guidance for monetary policy may trigger a bullish reaction in the US Dollar if the central bank lays out a tentative exit strategy.
Until then, USD/JPY may continue to retrace the decline from the monthly high (111.66) amid the improvement in risk appetite, but a further rebound in the exchange rate may fuel the flip in retail sentiment like the behavior seen earlier this year.
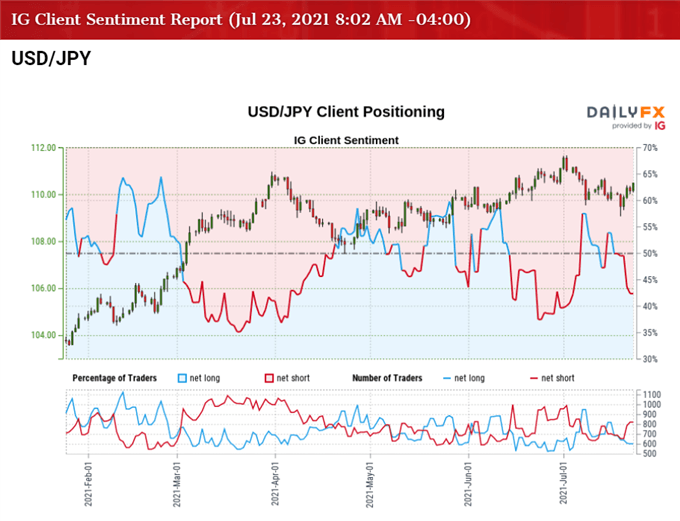
The IG Client Sentiment Report shows 45.73% of traders are currently net-long USD/JPY, with the ratio of traders short to long-standing at 1.19 to 1.
The number of traders net-long is 7.79% higher than yesterday and 17.82% lower from last week, while the number of traders net-short is 2.84% lower than yesterday and 10.67% higher from last week. The rise in net-long position could be a function of profit-taking behavior as USD/JPY trades to a fresh weekly high (110.59), while the rise in net-short interest has fueled the shift in retail sentiment as 49.41% of traders were net-long the pair last week.
With that said, current market conditions may keep USD/JPY afloat ahead of the Fed rate decision as the exchange rate appears to be tracking the recovery in US yields, and the decline from the yearly high (111.66) may turn out to be a correction in the broader trend as the exchange rate bounces back from the 50-Day SMA (109.98).
USD/JPY RATE DAILY CHART
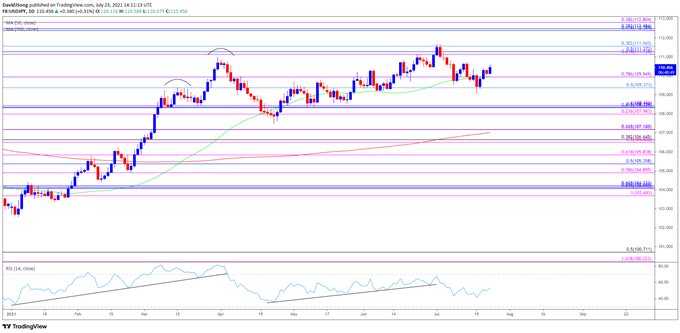
Source: Trading View
- USD/JPY approached pre-pandemic levels as a ‘golden cross’ materialized in March, with a bull flag formation unfolding during the same period as the exchange rate traded to a fresh yearly high (110.97).
- The Relative Strength Index (RSI) showed a similar dynamic as the indicator climbed above 70 for the first time since February 2020, but the pullback from overbought territory has undermined the upward trend from this year, which briefly pushed USD/JPY below the 50-Day SMA (109.98) for the first time since January.
- Nevertheless, USD/JPY reversed ahead of the March low (106.37) to largely negate the threat of a head-and shoulders formation, with the exchange rate climbing back above the moving average to trade to a fresh yearly high (111.12) in June.
- A similar scenario has taken shape in July as the exchange rate trades to a fresh yearly high (111.66), with the failed attempts to close below the 109.40 (50% retracement) to 110.00 (78.6% expansion) region bringing the Fibonacci overlap around 111.10 (61.8% expansion) to 111.60 (38.2% retracement) back on the radar.
- Need a break/close above the Fibonacci overlap around 111.10 (61.8% expansion) to 111.60 (38.2% retracement) to open up the February 2020 high (112.23), with the next area of interest comes in around 112.40 (61.8% retracement) to 112.80 (38.2% expansion).
Disclosure: See the full disclosure for DailyFX here.


