
USD/JPY Rate Forecast: RSI Sits In Oversold Zone Following Flash Crash
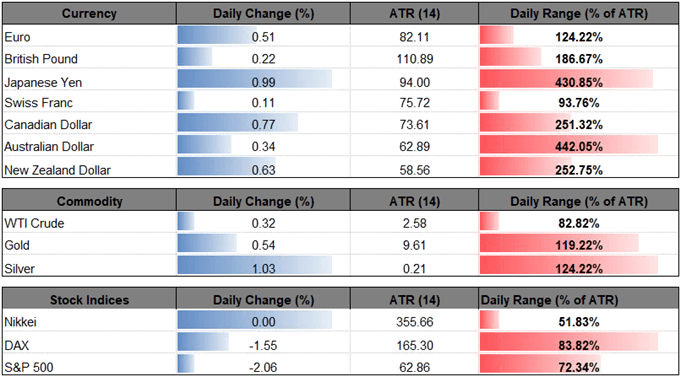
The 2019 opening range remains in focus for USD/JPY as a flash crash materializes during the first full week of January, and the 2018-low (104.63) remains on the radar ahead of the U.S. Non-Farm Payrolls (NFP) report as the exchange rate carves a string of lower highs & lows, while the Relative Strength Index (RSI) sits in oversold territory.
USD/JPY RATE FORECAST: RSI SITS IN OVERSOLD ZONE FOLLOWING FLASH CRASH

The USD/JPY flash crash has left FX traders in disarray, with market participants scrambling to find a reasonable explanation that would justify the sharp selloff that materialized in a matter of minutes.
Market participants are likely to side with their personal findings, whether fundamental or technical, as the macro environment remains clouded with high uncertainty, but the shift in market behavior may persist over the near-term as the pickup in dollar-yen volatility has been accompanied by falling U.S. Treasury yields along with battered stock prices.
(Click on image to enlarge)
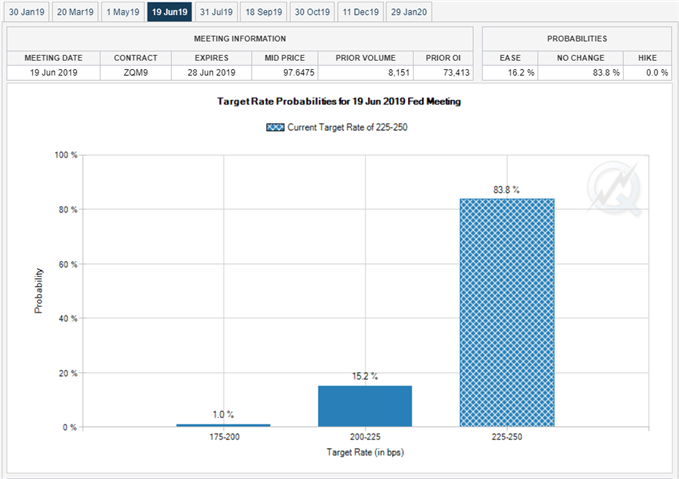
There appears to be a broader change in risk-taking behavior as gold prices also benefit from the current environment, and the lingering threat of a U.S.-China trade war paired with the gridlock in Congress may keep USD/JPY under pressure as Fed Fund Futures show interest rates on hold throughout the first-half of 2019.
Expectations for a less-hawkish Federal Reserve may continue to produce headwinds for USD/JPY as the central bank is widely expected to endorse a wait-and-see approach at the next interest rate decision on January 30, and a further depreciation in the dollar-yen exchange rate as the pickup in volatility fuels the recent shift in retail interest.
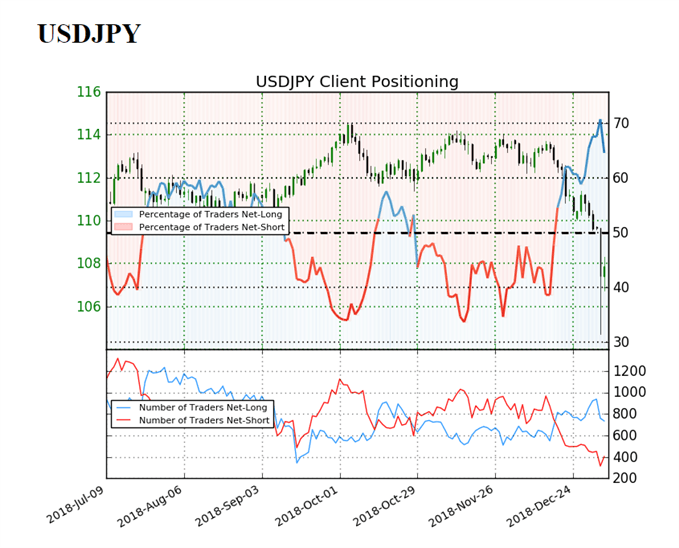
The IG Client Sentiment Report shows 64.6%of traders are now net-long USD/JPY compared to 63.8% last week, with the ratio of traders long to short at 1.82 to 1. Keep in mind, traders have remained net-long since December 18 when USD/JPY traded near 112.50 even though the price has moved 4.4% lower since then. The number of traders net-long is 18.8% lower than yesterday and 9.0% lower from last week, while the number of traders net-short is 18.1% lower than yesterday and 27.1% lower from last week.
The USD/JPY flash crash appears to have flushed out market participation amid the decline both net-long and net-short interest, but the ongoing tilt in retail sentiment provides a contrarian view to crowd sentiment, with the downside targets still on the radar as the exchange rate extends the series of lower highs & lows from the previous week. At the same time, recent developments in the Relative Strength Index (RSI) instills a bearish outlook for USD/JPY as the oscillator pushes back into oversold territory, with the exchange rate at risk for further losses as long as the momentum indicator holds below 30.
USD/JPY DAILY CHART
(Click on image to enlarge)
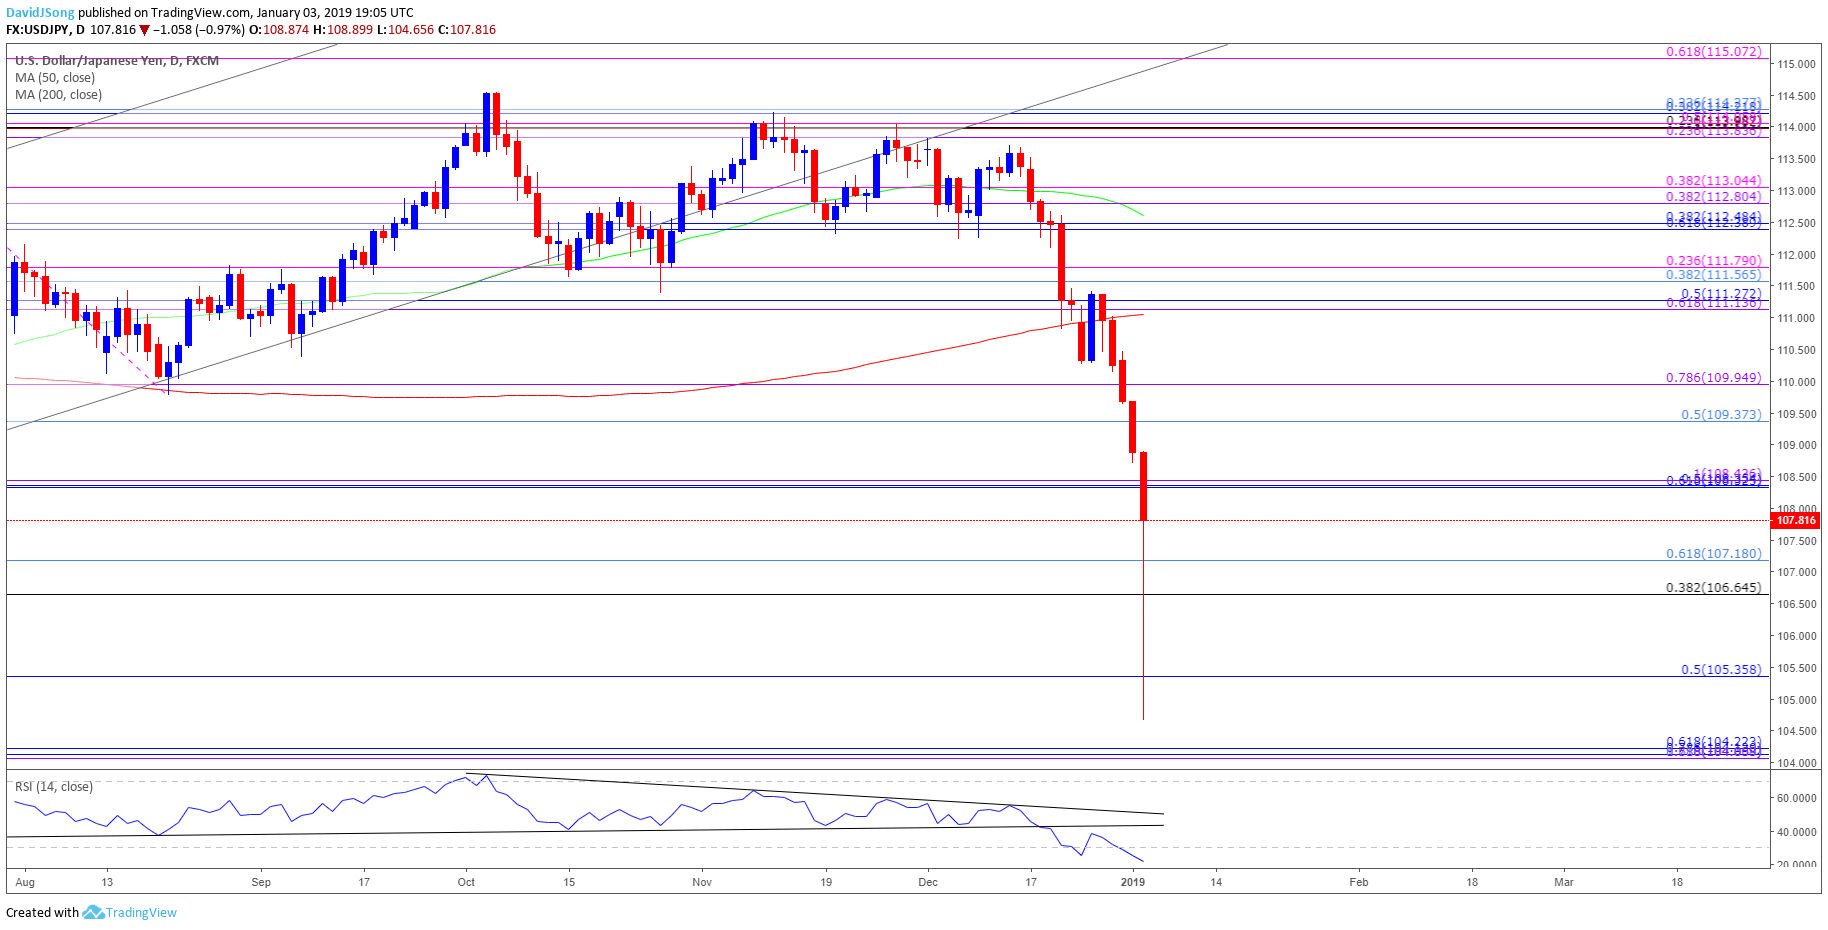
- The USD/JPY flash crash appears to have stalled ahead of the 2018-low (104.63), but the bearish sequence keeps the downside targets on the radar especially as the RSI tracks the bearish formation carried over from October.
- Waiting for a close below the 106.70 (38.2% retracement) to 107.20 (61.8% retracement) region to spur another run at the 105.40 (50% retracement) area, with the next downside hurdle coming in around 104.10 (78.6% retracement) to 104.20 (61.8% retracement).
For more in-depth analysis, check out the Q1 2019 Forecast for the Japanese ...
more

