
USD/JPY is currently trading in the 158.50s as it continues rising up in an ascending channel. It is now quite close to 160.32, the April 26 high – its highest level since 1986.
USD/JPY Weekly Chart
(Click on image to enlarge)
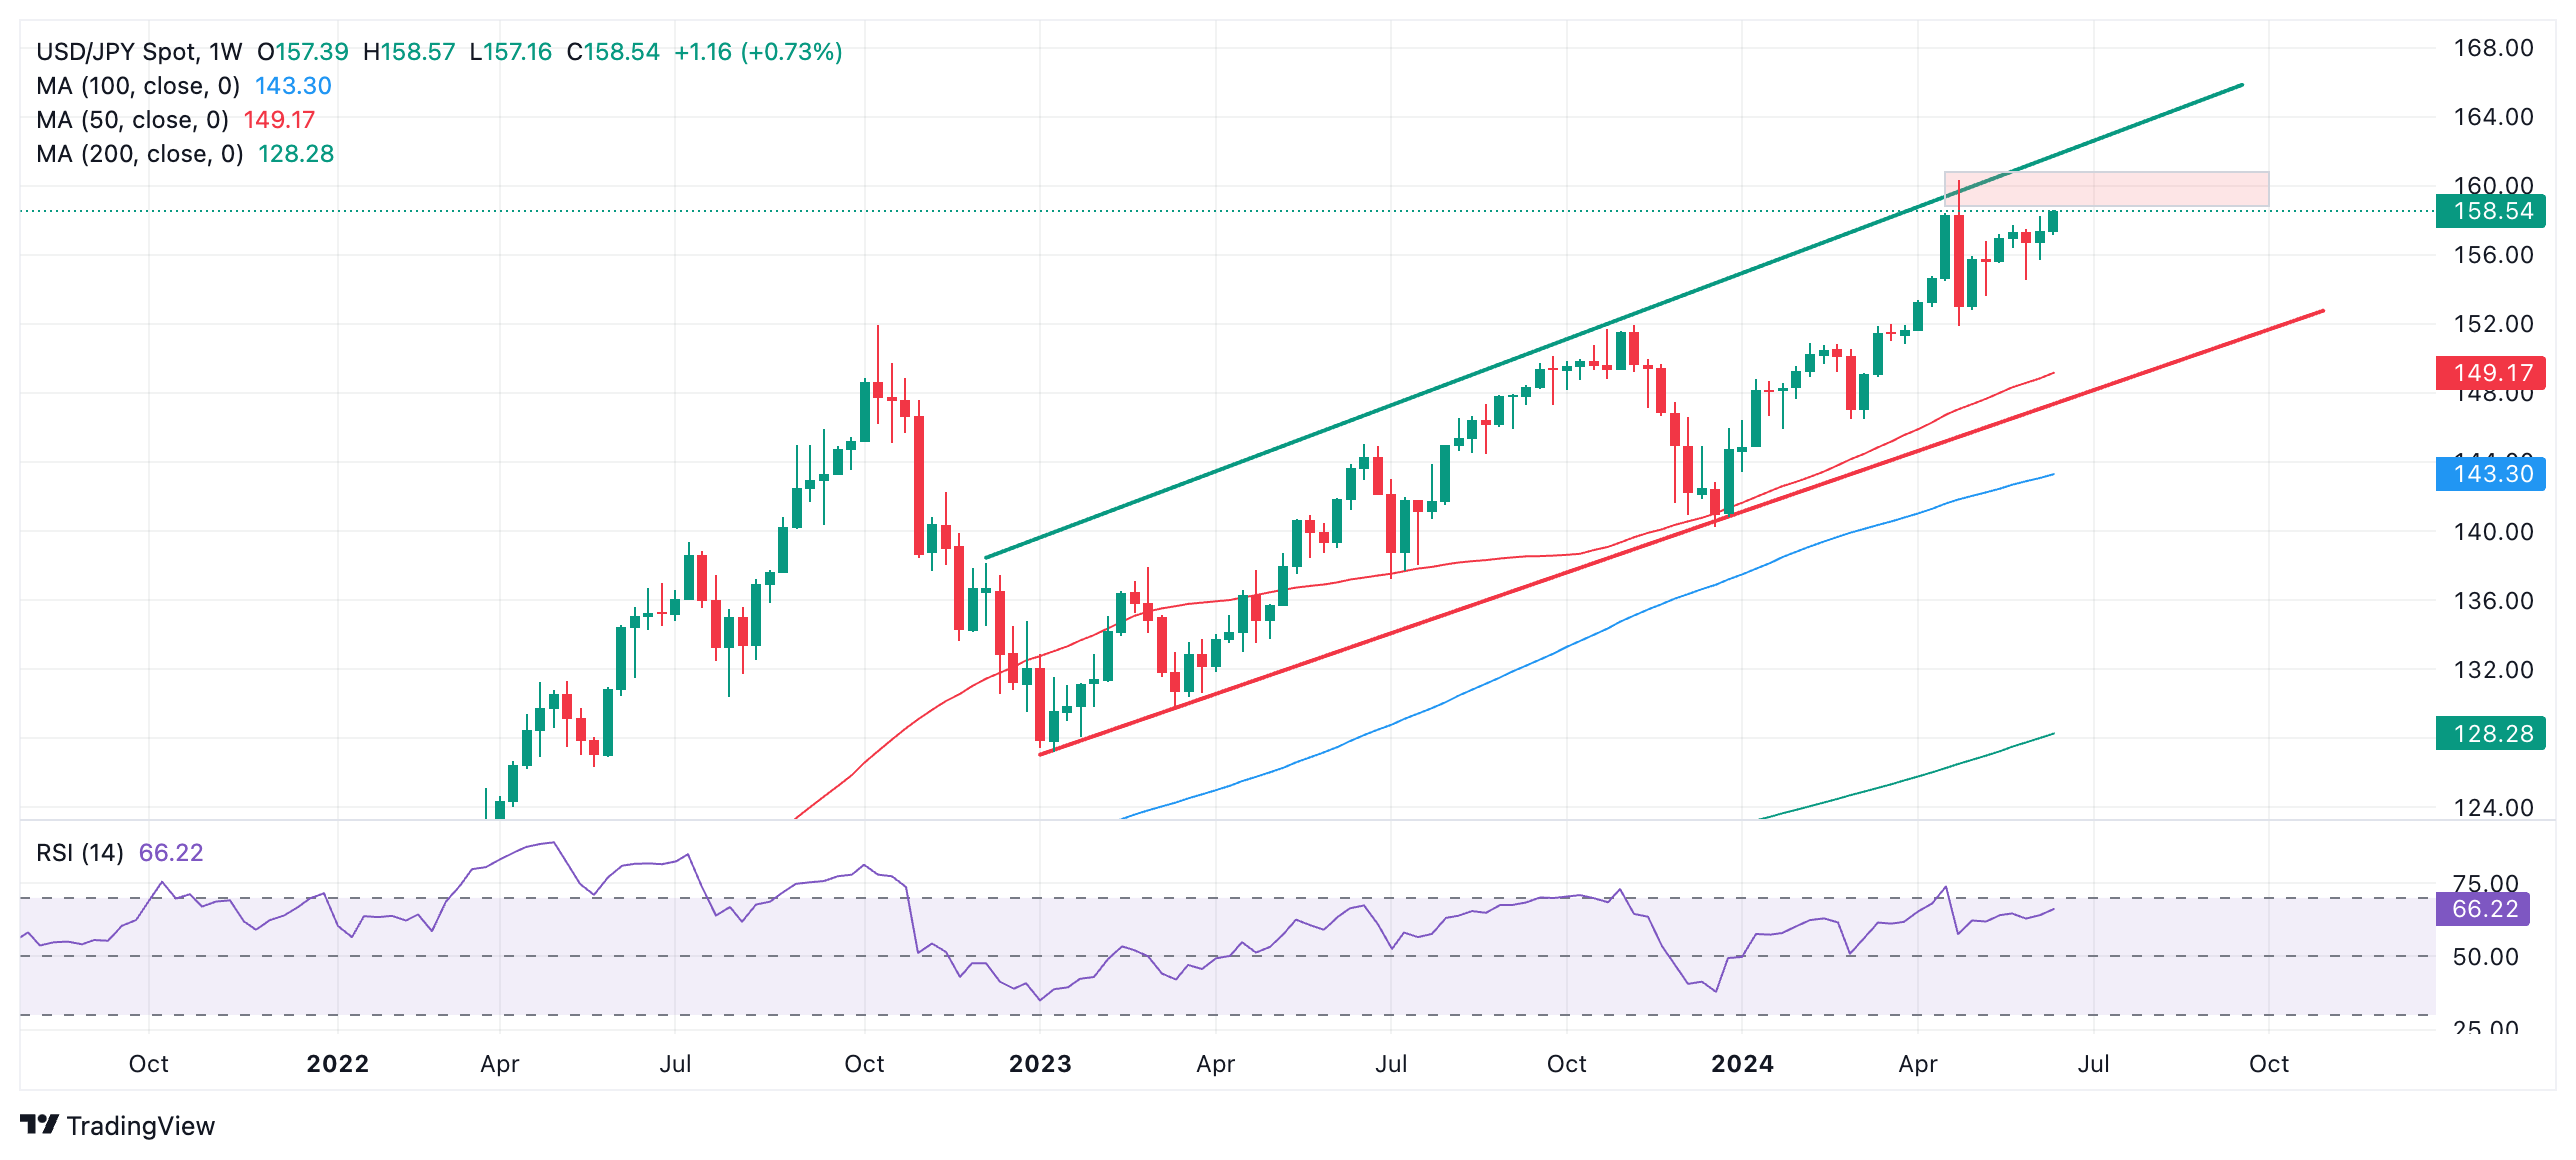
USD/JPY is now close to the “intervention zone” (red shaded band) around where the Japanese authorities intervened to support the Yen on April 29 and May 2, according to data from the BoJ. This can be seen as the long red candle that represents the last week in April.
On Thursday, Japan’s top currency diplomat, Masato Kanda, warned, “The government will respond to excessive currency moves”, adding that, “There is no limit for forex intervention resources”.
From a purely technical point of view the trend is bullish on all time frames and given the saying that “the trend is your friend” it is more likely than not to continue higher.
However, the USD/JPY is a special case because of the high risk of market manipulation by the Japanese authorities. As such, traders should be cautious before assuming the pair will simply go higher as the trend extends.
More By This Author:
Gold Trades Little Changed As Fed Rate-Cut Expectations SustainUSD/JPY Holds Steady Near 158.00 Mark, Just Below Its Highest Level Since Late April
Gold Price Advances To Over One-Week Top, Closer To 50-Day SMA Pivotal Resistance


Comments
Log in or sign up to join the conversation.