
USDJPY Outlook A Correction Or Reversal Of The Prevailing Bull Trend?
Over the past week, there has been a remarkable charge in risk trends that has been most pronounced in the performance of the US indices like the S&P 500 and Dow. While this is attracting considerable attention – and rightfully so – there has been a different standard-bearer for risk trends that has outpaced that top benchmark for some time: USDJPY. Though made up of two safe-haven currencies, there is serious carry trade implication for this pair as the Fed is ramping at the forefront of tightening speculation among major central banks. And, with the robust NFPs this past Friday and record-breaking ISM service sector activity report this morning, it would seem that rate advantage and risk appetite should only further back USDJPY ascent. That said, the pair is actually working on its biggest single-day retreat in eight weeks. Are technicals suggesting the fundamentals on this pair are going to be overruled?
Chart of USDJPY with 1-Day Rate of Change (Daily)
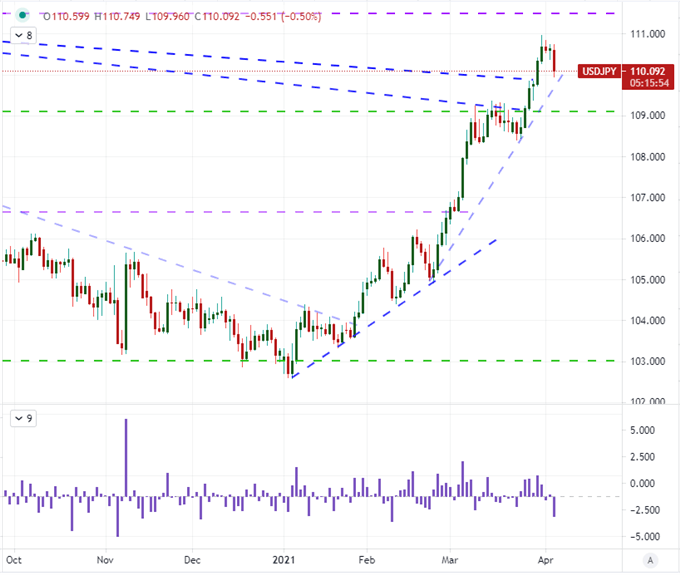
Chart Created on TradingView Platform
Looking more directly at the pacing for this pair as of late, we have seen a remarkable charge. From its low set the second day of trading this year, USDJPY has climbed as much as 840 points (8.2 percent) with a clip that has steadily outpaced the 20-day moving average since the brief dip of spot below back on January 21st. Since then, the momentum has accelerated which shows well in the spot-to-100DMA ratio shown below. It is difficult to keep up a pace like this for long.
Chart of USDJPY with 20 and 100-Day Moving Averages and Spot-100DMA Spread (Daily)
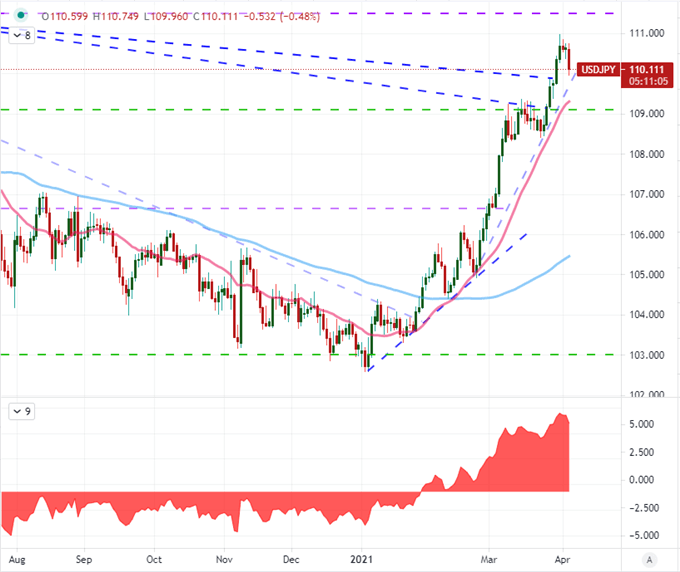
Chart Created on TradingView Platform
It would seem that there is little holding back a further extension of the trend and therefore this naturally just seems to be a brief reprise in a larger bull trend – particularly because the fundamentals are hard to align to price action. However, on the higher time frame, we start to appreciate better the scale of levels that are still above. If you look at a monthly chart, we see that the 109.25 and 110 levels were resistance on very large wedge formations that were cleared on the strongest monthly advance we’ve seen since November 2016. Yet, the congestion over the past six years to the upside makes for many subsequent levels that can slow the advance. Further, there are very large Fibonacci levels above. The 50 percent retracement of the 2015 to present range falls around 112.30. However, I’m more impressed by the midpoint of the pair’s historical range which is closer at 111.50.
Chart of USDJPY with 1-Mont Rate of Change (Monthly)
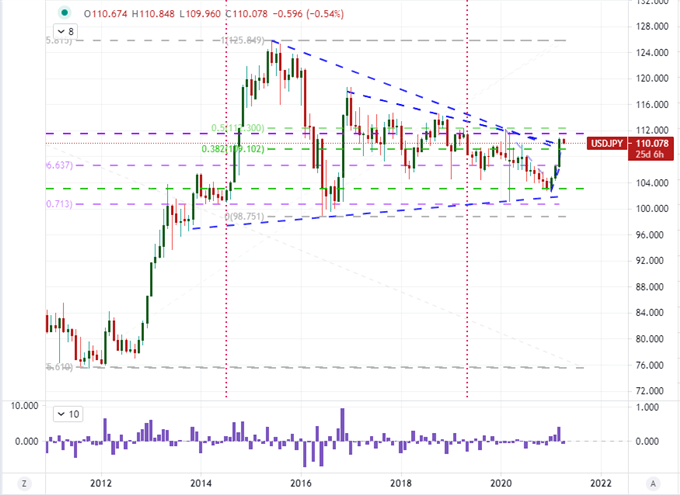
Chart Created on TradingView Platform
Some light fundamentals to take into consideration with this move is the correlation the pair holds to benchmark risk assets. As mentioned before, USDJPY and other Yen crosses are considered carry trade which is essentially the ‘dividend approach for the FX market’. Over the past 20-days (equivalent to one trading month) the correlation between pair and S&P 500 is positive 0.75 which is a strong positive lean – meaning they tend to move in the same direction and close to the same pacing, relatively speaking. Yet, in the past 5-day (one week), we’ve seen the relationship flip sharply to -0.52. Keep tabs on this.
Chart of USDJPY Overlaid with S&P 500 and 5-Day and 20-Day Correlations (Daily)
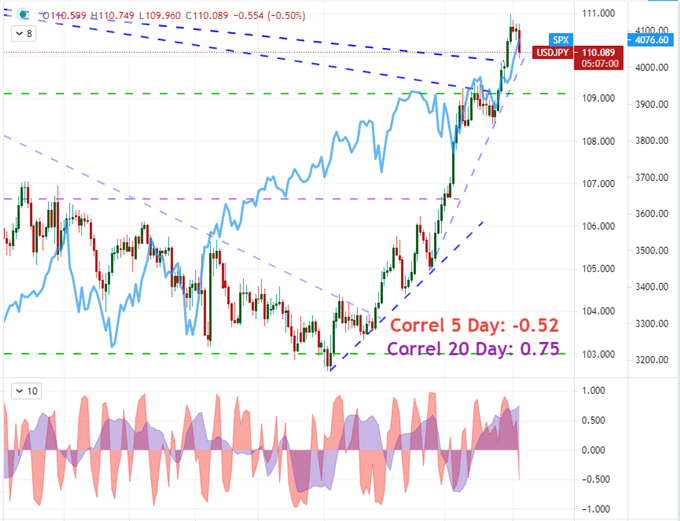
Chart Created on TradingView Platform
A deviation of USDJPY to general risk assets would be necessary to see the pair drop significantly lower if sentiment carries on with its bullish ambitions. Then again, if risk aversion were to kick in, I believe the correlation would tighten up unless the situation deteriorated to the point of looking for absolute havens – and at that point, there are bigger issues at hand. Another theme is the yield forecasts that back the carry trade factor. The difference between the US and Japanese 10-year yields has pushed to the highest levels in 13 months, mostly the US responsibility, and the rate forecast from Fed Fund futures is the highest in about the same period as the market almost fully prices in a hike by December 2022. This could keep the bullish view intact as well so long as the US economy does well and inflation forecasts follow.
Chart of USDJPY Overlaid with the US and Japan 10-Year Yield Differential (Daily)
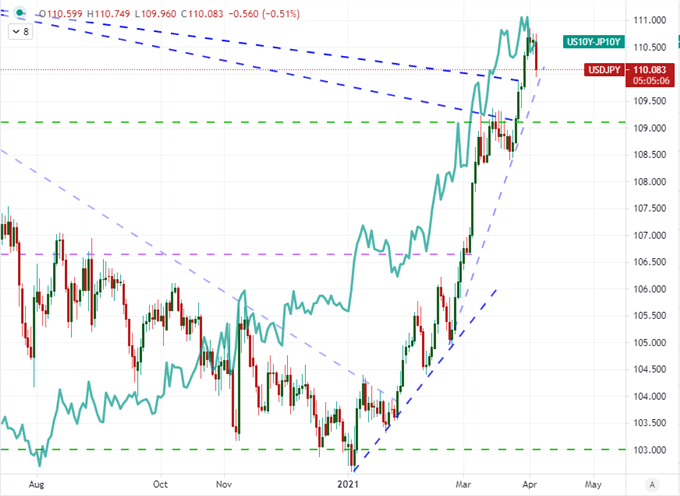
Chart Created on TradingView Platform
Disclosure: See the full disclosure for DailyFX here.


