
USD/JPY Forms Indecision Triangle Pattern At 112
USD/JPY
4 hour
(Click on image to enlarge)
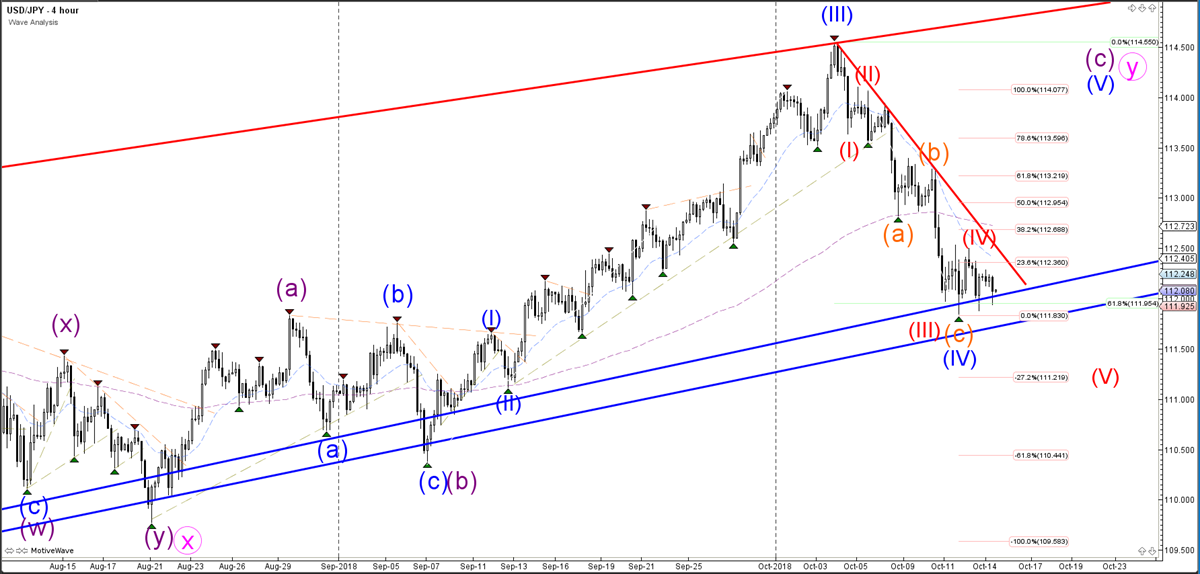
Source: Admiral Markets MT5 with MT5SE Add-on USD/JPY motive wave – Accessed 15 October 2018 at 5:00 AM GMT
The USD/JPY currency pair made a bearish bounce at the 23.6% Fibonacci retracement level, which could be part of a wave 4 (red) pattern and the start of the wave 5 (red). A bullish break however, indicates that the price is still in a bullish wave 4-5 (blue) pattern.
1 hour
(Click on image to enlarge)

Source: Admiral Markets MT5 with MT5SE Add-on USD/JPY motive wave – Accessed 15 October 2018 at 5:00 AM GMT
The USD/JPY currency pair is testing key support trend lines (blue), and the price is expected to make a bounce or break, which will depend on the candlestick patterns that appear.
Daily
(Click on image to enlarge)

Source: Admiral Markets MT5 with MT5SE Add-on USD/JPY motive wave – Accessed 15 October 2018 at 5:00 AM GMT
The USD/JPY currency pair has completed the wave Y (pink) of wave D (purple), if the price manages to break below support. A bounce at the support indicates a potential bullish continuation.
Disclaimer: The opinions in this article are for informational and educational purposes only and should not be construed as a recommendation to buy or sell the stocks mentioned or to solicit ...
more

