
USD/JPY Bearish Breakout After Pullback In Downtrend Channel
USD/JPY
4 hour

Source: Admiral Markets MT5 with MT5SE Add-on USD/JPY motive wave
The USD/JPY bearish channel is staying within the support and resistance trend lines, which probably makes it a wave C (pink). However, price will need to break below the bottom of wave A (pink) before any bearish continuation can be confirmed. The support trend line is a key decision zone, and offers a spot to trade a bullish bounce or bearish break. A bullish bounce makes an expanded wave B likely, whereas a bearish break confirms the wave C pattern (pink).
1 hour
(Click on image to enlarge)
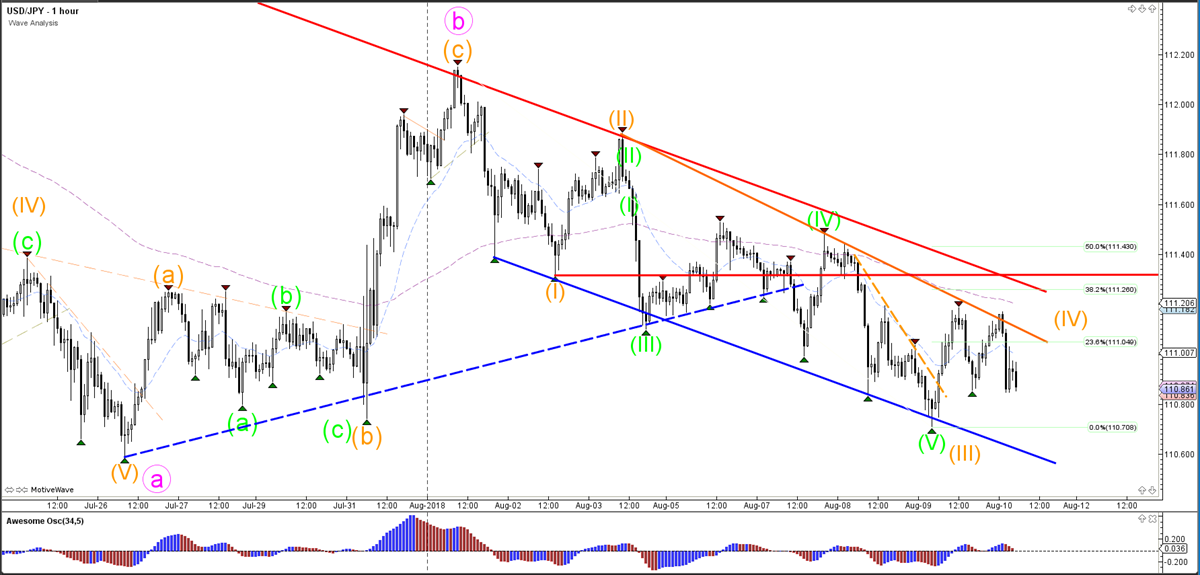
Source: Admiral Markets MT5 with MT5SE Add-on USD/JPY motive wave
The USD/JPY is moving choppily within the downtrend channel, but price could be in a 4th wave (orange) if price manages to stay below the bottom of wave 1 (red line) and the 38.2% Fibonacci retracement level. Price has now broken below the support trend line (dotted green). A break above resistance could indicate that a bearish wave pattern is failing and could start a larger bullish correction.
Disclaimer: The opinions in this article are for informational and educational purposes only and should not be construed as a recommendation to buy or sell the stocks mentioned or to solicit ...
more

