
USD/JPY Bearish ABC Pattern In Wave 4 Respects 50% Fib
The USD/JPY has been in a range for several years. Price action is probably unfolding in an ABCDE triangle chart pattern (purple).
This article analyses the Elliott Wave, Fibonacci, and chart patterns for more guidance on what to expect on the daily and monthly charts.
Price Charts and Technical Analysis
(Click on image to enlarge)
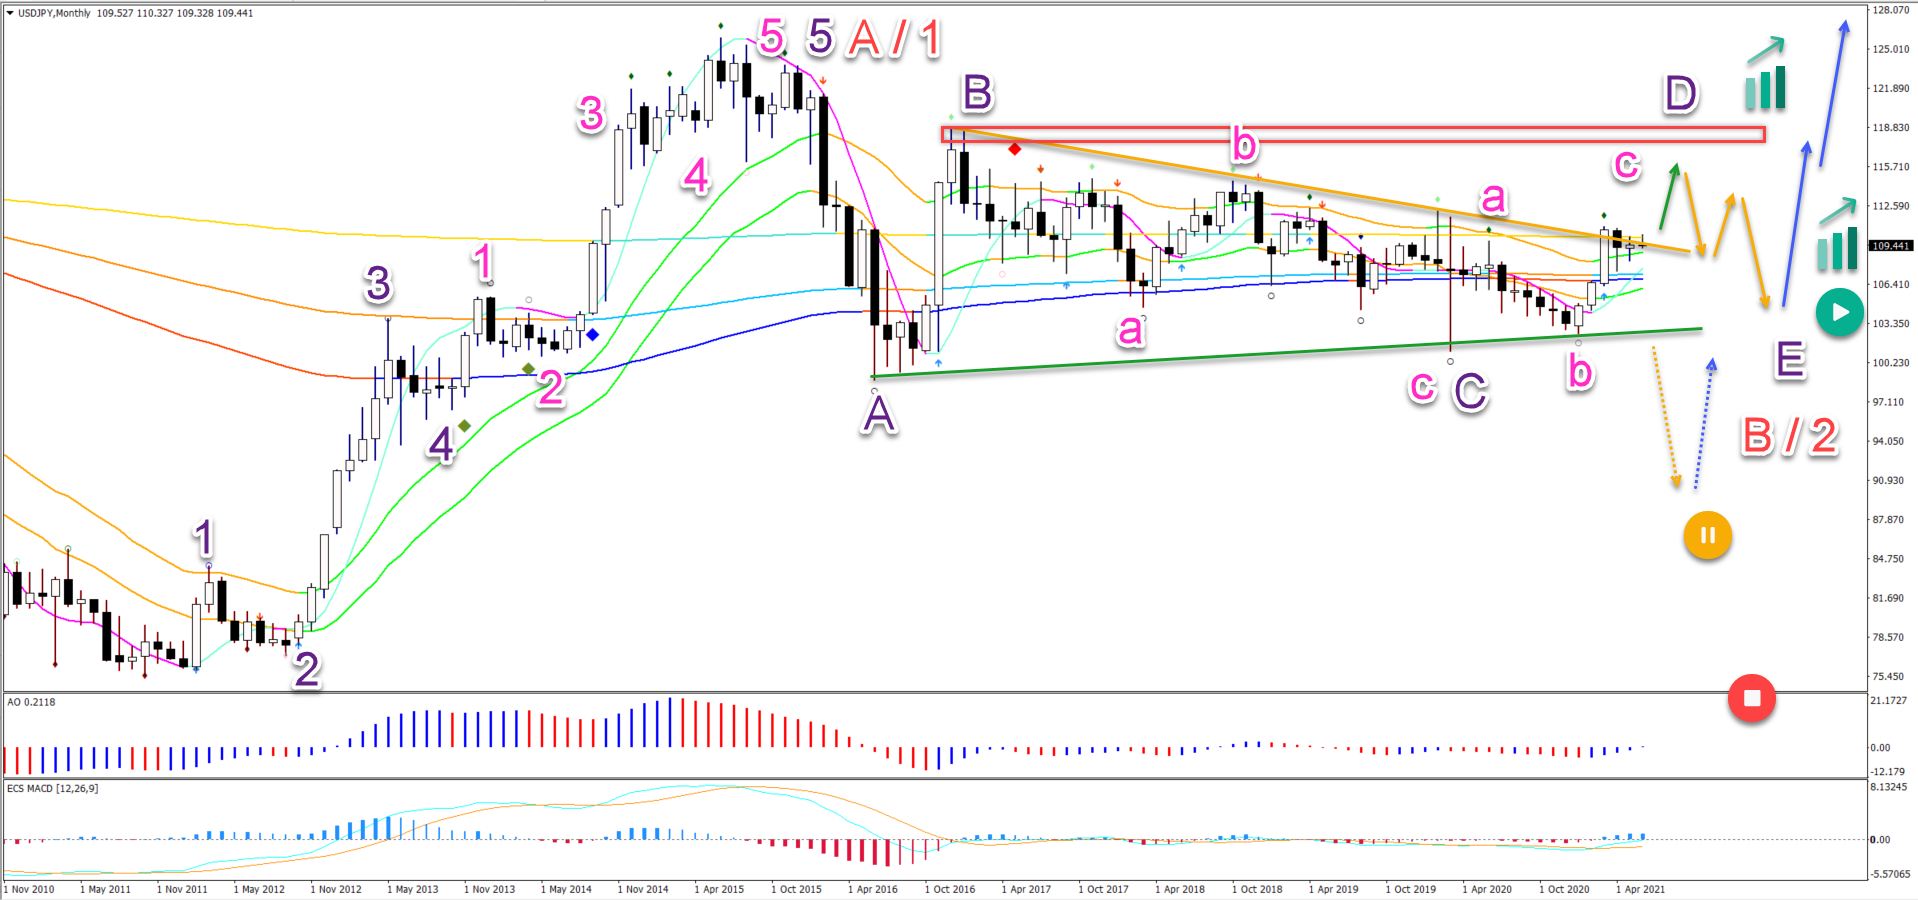
The USD/JPY seems to have completed 5 bullish waves (purple) in a wave A or 1 (red). The current correction could be an ABCDE (purple) pattern in the wave B or 2 pullback (red):
- A bearish ABC (pink) pattern is completed in wave C (purple).
- Now price action seems to be building an ABC (pink) in wave D (purple).
- A break (green arrow) above the resistance trend line (orange) could confirm it.
- The wave D (purple) remains valid as long as price action remains below the top of wave B (red box).
- The wave E (purple) remains valid as long as price action remains above the bottom of wave C.
- A breakout (dotted orange arrow) below the support trend line (green) invalidates the bearish ABCDE but does not invalidate wave B or 2.
- Only a break below the bottom invalidates (red circle) the AB or 12 (red).
- A bullish bounce (blue arrow) after an ABC in wave E (purple) could confirm the uptrend.
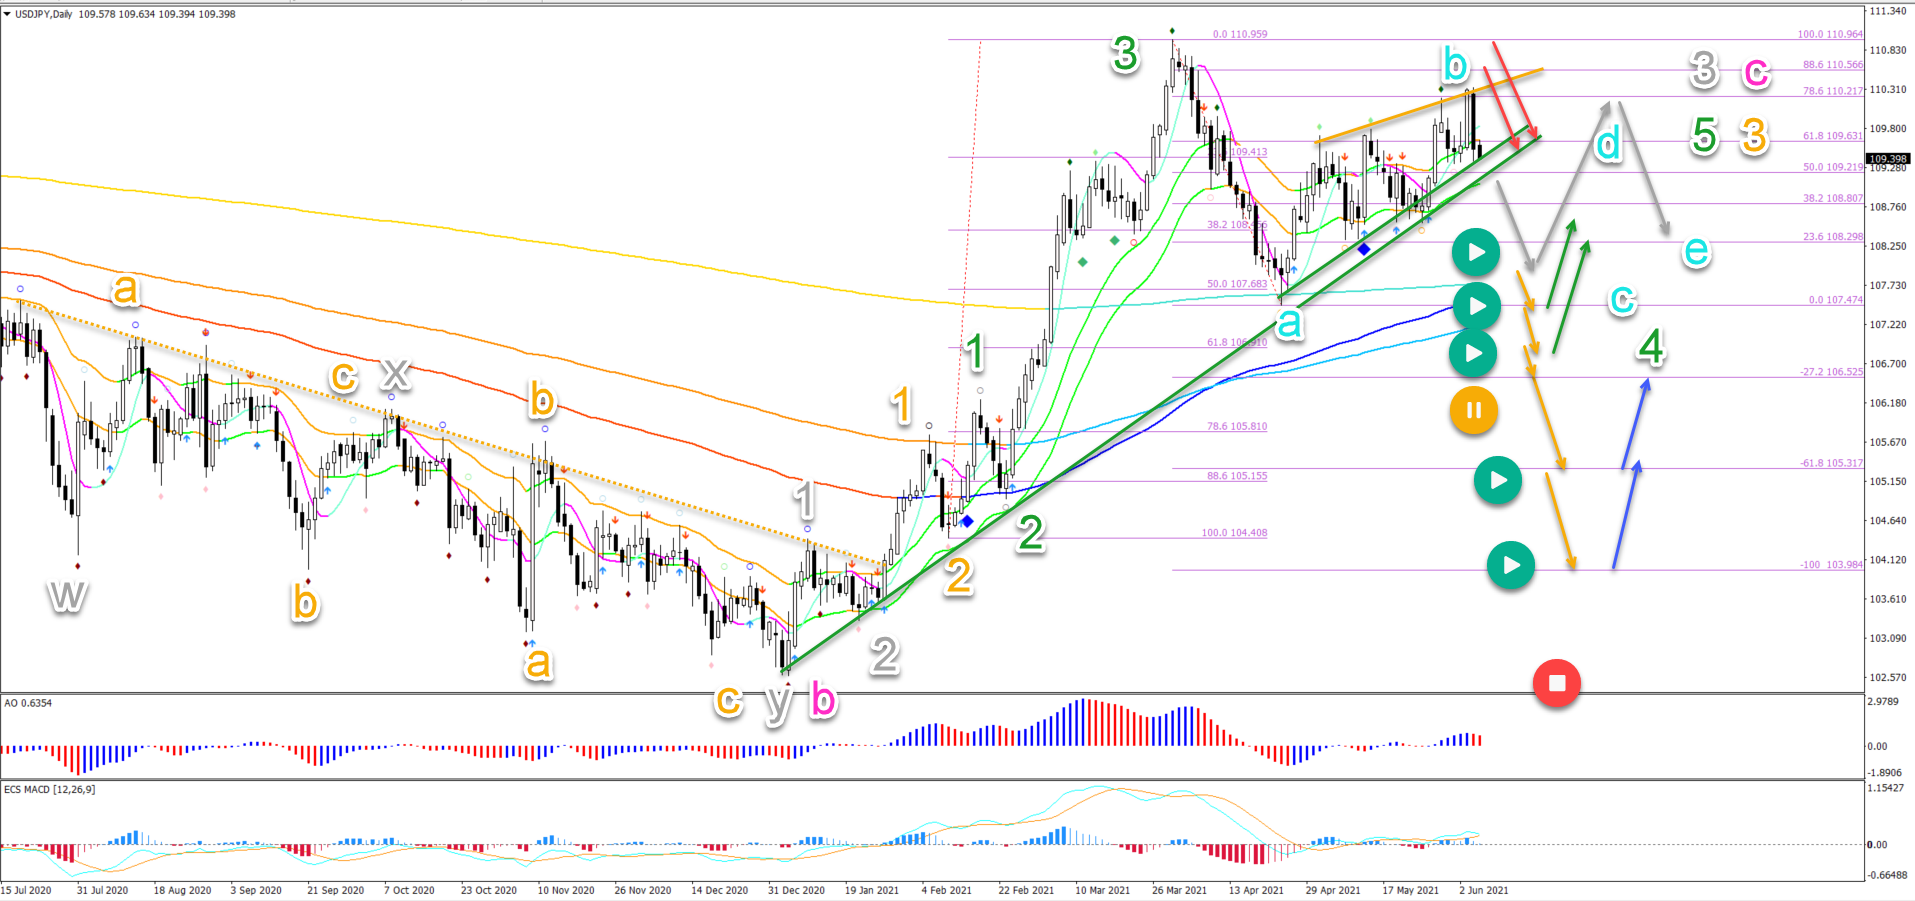
On the daily chart, price action seems to be building a correction after a bullish momentum:
- The bullish impulse is probably a wave 3 (green).
- The pullback is moving sideways, which is typical for wave 4 (green).
- The bullish price action has been choppy so the current leg is probably a wave B (blue).
- A larger ABC or ABCDE (blue) correction could take place in wave 4 (green) as long as price action remains above the 61.8% Fibonacci level.
- A bearish bounce (red arrows) at the top could indicate a deeper wave B.
- A bearish breakout and bounce above the bottom (grey arrows) could indicate an ABCDE triangle.
- A bearish breakout (orange arrows) below the support (green) and bottom could indicate an ABC (blue) pattern.
- A break below the long-term moving averages and 1.8% Fibonacci levels puts wave 4 (green) on hold. In that case, a wave C (pink) could have been completed at the recent high and a bearish ABC down is taking place in wave E (purple).
(Click on image to enlarge)
Disclaimer: CFDs are complex instruments and come with a high risk of losing money rapidly due to leverage. On average around 80% of retail investor accounts loose money when trading with high ...
more

