
USD/CAD Weighed By Sticky Core CPI- Canada GDP Report Up Next
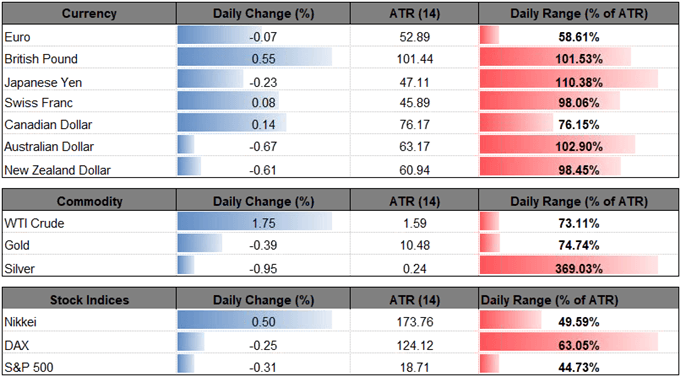
USD/CAD remains under pressure following the updates to Canada’s Consumer Price Index (CPI), and recent price action raises the risk for a further decline in the exchange rate as it slips back below the 200-Day SMA (1.3152).
USD/CAD WEIGHED BY STICKY CORE CPI- CANADA GDP REPORT UP NEXT

The fresh CPI print should keep the Bank of Canada (BoC) on the sidelines at the next meeting on March 6 as the headline reading narrows to 1.4% from 2.0% per annum in December, but the stickiness in the core rate of inflation may keep the central bank on track to further normalize monetary policy as trimmed-mean index holds steady at 1.9% for the third consecutive month.
(Click on image to enlarge)
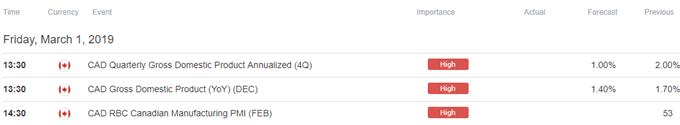
With that said, the 4Q Gross Domestic Product (GDP) report due out later this week may do little to alter the monetary policy outlook as the ‘Governing Council continues to judge that the policy interest rate will need to rise over time into a neutral range to achieve the inflation target,’ and Governor Stephen Poloz & Co. may continue to prepare Canadian households and businesses for higher borrowing-costs as ‘indicators of demand should start to show renewed momentum in early 2019, leading to above-potential growth of 2.1 per cent in 2020.’
In turn, USD/CAD may exhibit a more bearish behavior over the near-term especially as the Federal Reserve alters the forward-guidance for monetary policy, and it seems as though the Federal Open Market Committee (FOMC) will continue to change its tune in 2019 as Chairman Jerome Powell states that ‘the Committee can now evaluate the appropriate timing and approach for the end of balance sheet runoff.’ With the FOMC now preparing to taper the $50B/month in quantitative tightening (QT), the shift in Fed policy may keep USD/CAD under pressure, and price action raises the risk for a further decline in the exchange rate as it slips back below the 200-Day SMA (1.3152).
Keep in mind, the broader outlook for USD/CAD remains constructive following the break of the June-high (1.3386), while the bear-flag from earlier this year appears to have run its course amid the failed attempt to test the November-low (1.3049). The key test comes as USD/CAD bounces along the 200-Day SMA, with dollar-loonie staging a near-term rebound the last three instances the exchange rate dipped below the moving average. As a result, the monthly range is on focus for the coming days, with USD/CAD at risk of exhibiting a more bearish behavior if the exchange rate fails to respond to the moving average and ends up taking out the 2019-low (1.3068).
USD/CAD DAILY CHART
(Click on image to enlarge)
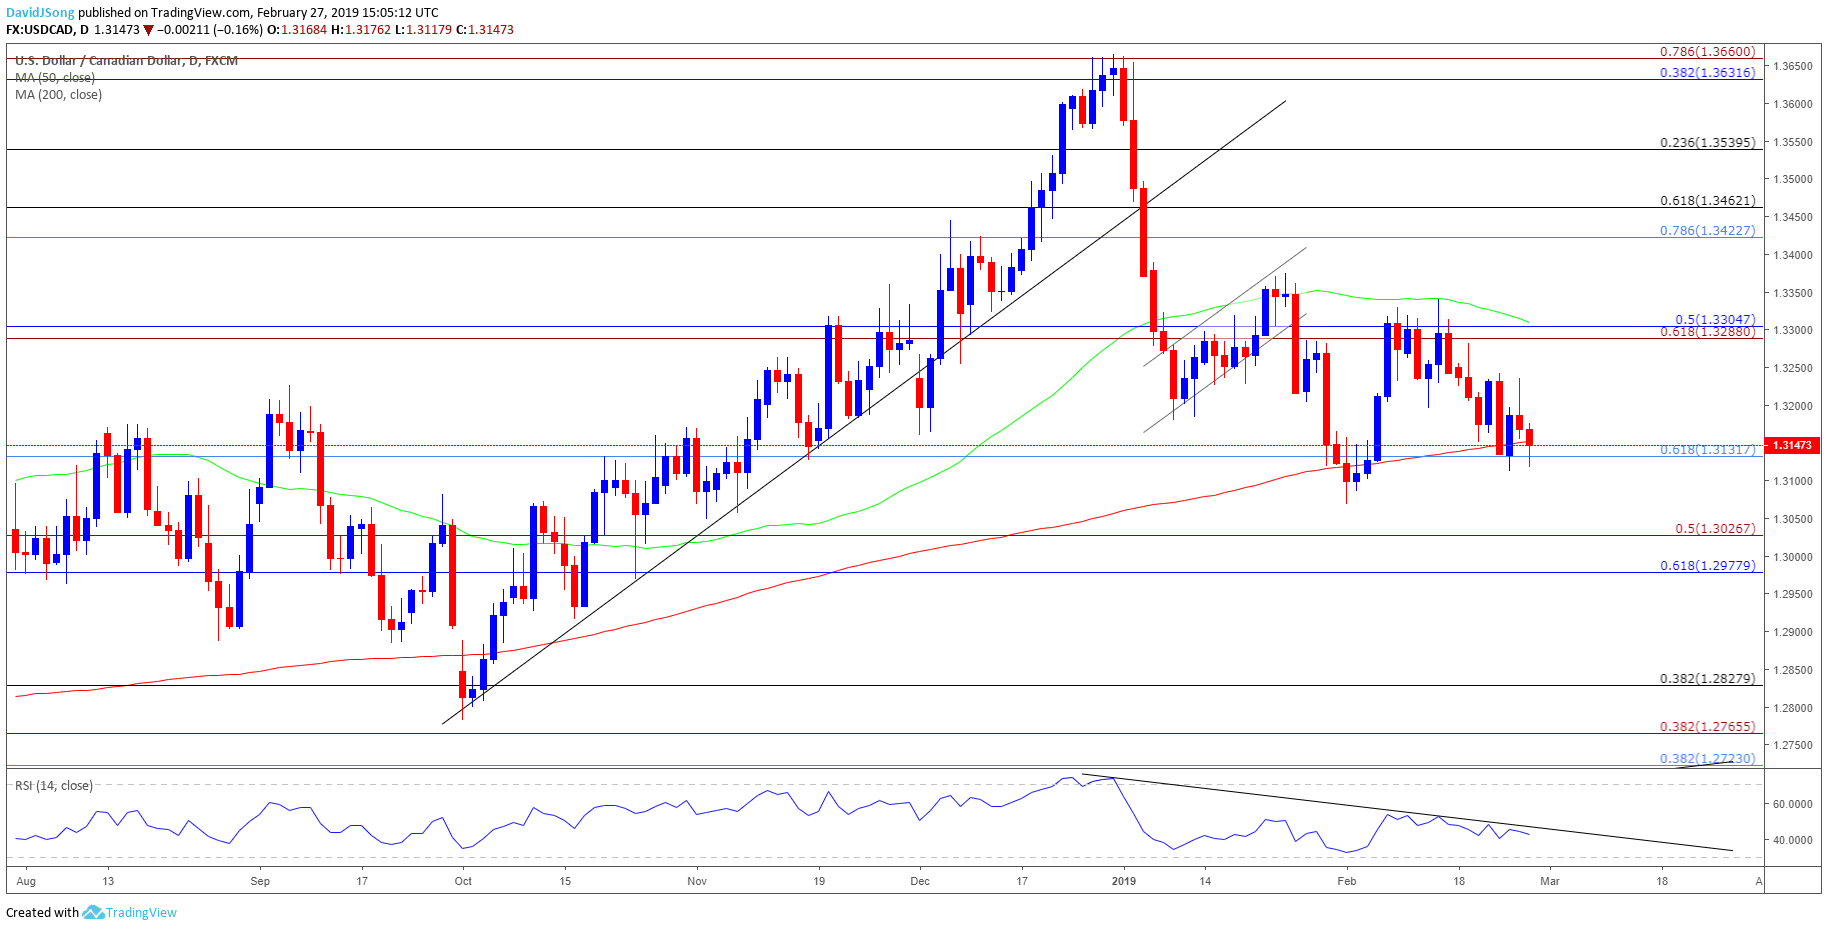
- The correction from the January-high (1.3663) may continue to evolve as USD/CAD bounces along the 200-Day SMA (1.3152), but a broader trend appears to be taking shape in the Relative Strength Index (RSI) as it carves a bearish formation in 2019.
- In turn, a close below 1.3130 (61.8% retracement) may spur a more meaningful run at the November-low (1.3049), but need a break/close below the Fibonacci overlap around 1.3290 (61.8% expansion) to 1.3310 (50% retracement) to highlight a broader shift in USD/CAD behavior.
- Next downside hurdle comes in around 1.2830 (38.2% retracement) followed by the overlap around 1.2720 (38.2% retracement) to 1.2770 (38.2% expansion), which sits just beneath the October-low (1.2780).


