
USD/CAD Reverses Ahead Of 200-Day SMA As Canada GDP Contracts
USD/CAD appears to have reversed course ahead of the 200-Day SMA (1.2539) as Canada’s Gross Domestic Product (GDP) report shows a 1.1% decline in the growth rate versus forecasts for a 2.5% rise, and the exchange rate may trade to fresh yearly highs throughout the remainder of the year as an inverse head-and-shoulders formation takes shape.
The break above the January high (1.2881) may continue to reflect a change in the broader trend as the Bank of Canada (BoC) insists that “the recovery continues to require extraordinary monetary policy support,” and it seems as though Governor Tiff Macklem and Co. will retain the current policy at its next interest rate decision on September 8 as the central bank pledges to “provide the appropriate degree of monetary policy stimulus to support the recovery and achieve the inflation objective.”
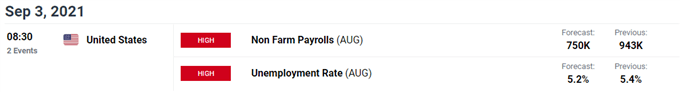
Until then, the update to the US NFP report may influence USD/CAD as the economy is expected to add 750K jobs in August, and the progress towards ‘full-employment’ may generate a bullish reaction in the US Dollar as it puts pressure on the Federal Open Market Committee (FOMC) to deploy an exit strategy sooner rather than later.
At the same time, a dismal development may drag on USD/CAD as it encourages the FOMC to retain the current policy at its next quarterly meeting in September, but a further decline in the exchange rate may fuel the recent flip in retail sentiment like the behavior seen earlier this year.
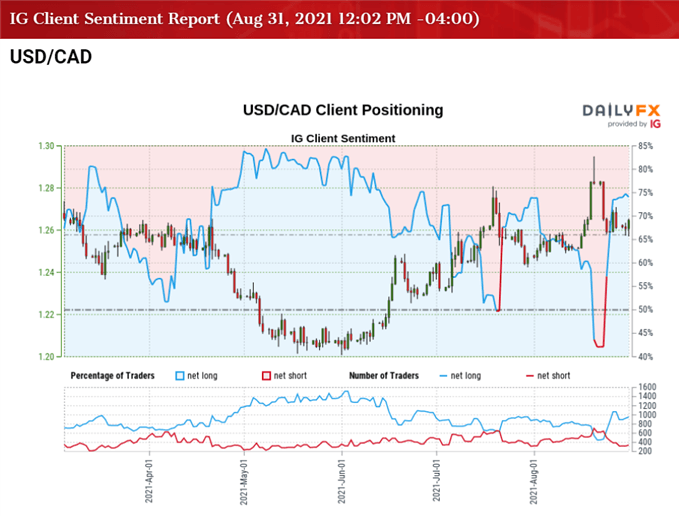
The IG Client Sentiment Report shows 74.00% of traders are net-long USD/CAD following the pullback from the monthly high (1.2949), with the ratio of traders long to short standing at 2.85 to 1.
The number of traders net-long is13.45% higher from last week, while the number of traders net-short is 28.29% lower from last week. The rise in net-long interest has fuel flip in retail sentiment as 42.07% of traders were net-long USD/CAD last week, while the decline in net-short position comes as the exchange rate appears to be reversing course ahead of the 200-Day SMA (1.2539).
With that said, the pullback from the monthly high (1.2949) may end up being short-lived as a key reversal pattern materializes, and the exchange rate may stage further attempts to test the December 2020 high (1.3009) as there appears to be a change in the broader trend.
USD/CAD RATE DAILY CHART
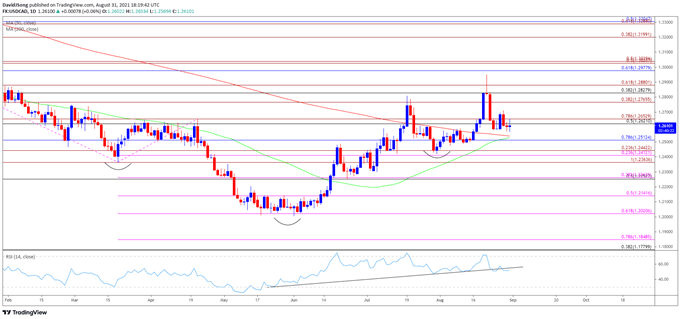
Source: Trading View
- The break above the January high (1.2881) reflects a shift in the broader trend as an inverse head-and-shoulders formation takes shape, with the 50-Day SMA (1.2529) developing a positive slope as USD/CAD trades to fresh yearly highs in August.
- In turn, the pullback from the monthly high (1.2949) may end up being short-lived as USD/CAD appears to be reversing course ahead of the 200-Day SMA (1.2539), with a move back above the Fibonacci overlap around 1.2620 (50% retracement) to 1.2650 (78.6% expansion) bringing the 1.2770 (38.2% expansion) region on the radar.
- Next area of interest comes in around 1.2830 (38.2% retracement) to 1.2880 (61.8% expansion), with a move above the December 2020 high (1.3009) opening up the 1.3030 (50% expansion) to 1.3040 (50% expansion) area.
- However, lack of momentum to hold above the 200-Day SMA (1.2539) may open up the 1.2510 (78.6% retracement) region, with the next area of interest coming in around 1.2410 (23.6% expansion) to 1.2440 (23.6% expansion).
Disclosure: See the full disclosure for DailyFX here.


