
USD/CAD Price Outlook: Rally Stalls At Critical Resistance Zone
The US Dollar is testing a critical resistance confluence against the Canadian Dollar and leaves the broader uptrend vulnerable into the start of the year. These are the updated targets and invalidation levels that matter on the USD/USD charts.
USD/CAD DAILY PRICE CHART
(Click on image to enlarge)
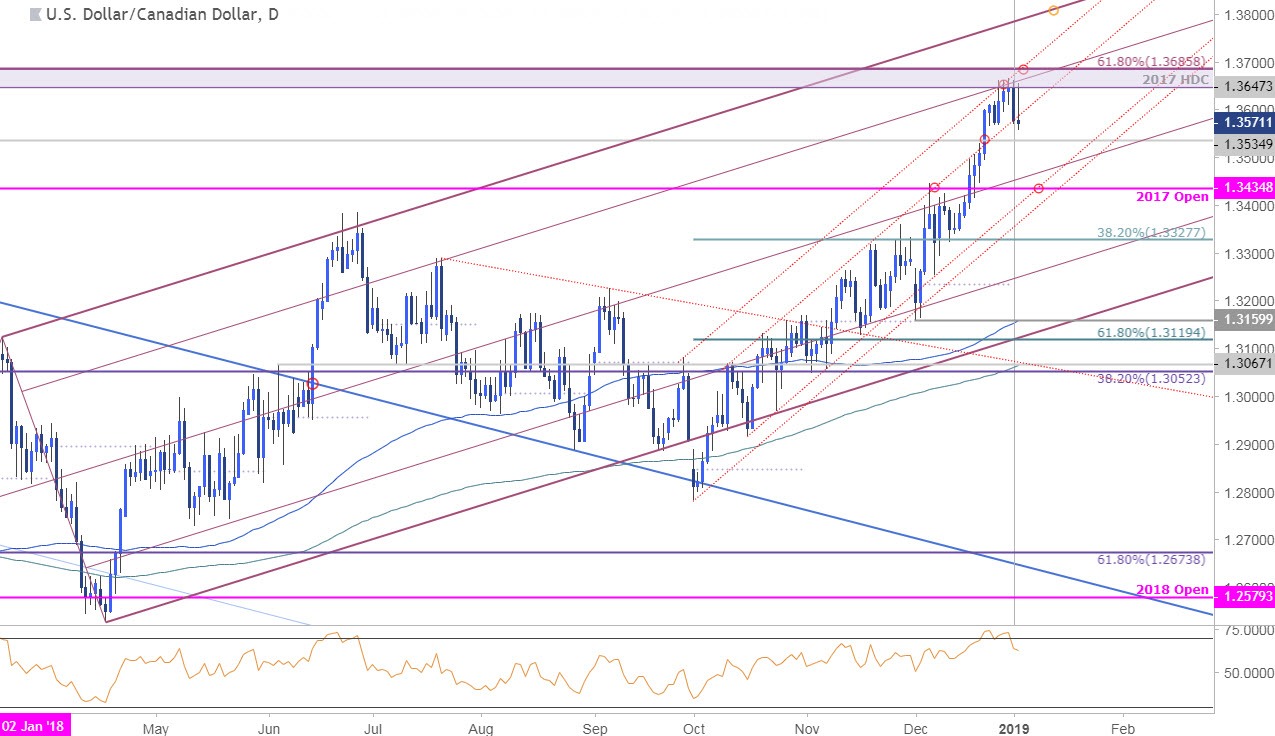
Technical Outlook: In my latest USD/CAD Weekly Technical Outlook we noted that the price breakout was, “accelerating towards the next major confluence resistance zone at the 61.8% retracement of the 2016 decline / 2017 high-week close at 1.3647/86.” Note that the 61.8% slope line of the broader 2017 ascending pitchfork formation also converges on this region into the start of the month and further highlights its technical significance.
Interim support rests with the median-line (currently ~1.3450s) backed closely by the October channel support / 2017 open at 1.3435- a break / close below this region would suggest that a larger price correction may be underway with such a scenario targeting the 38.2% retracement at 1.3328.
USD/CAD 240MIN PRICE CHART
(Click on image to enlarge)
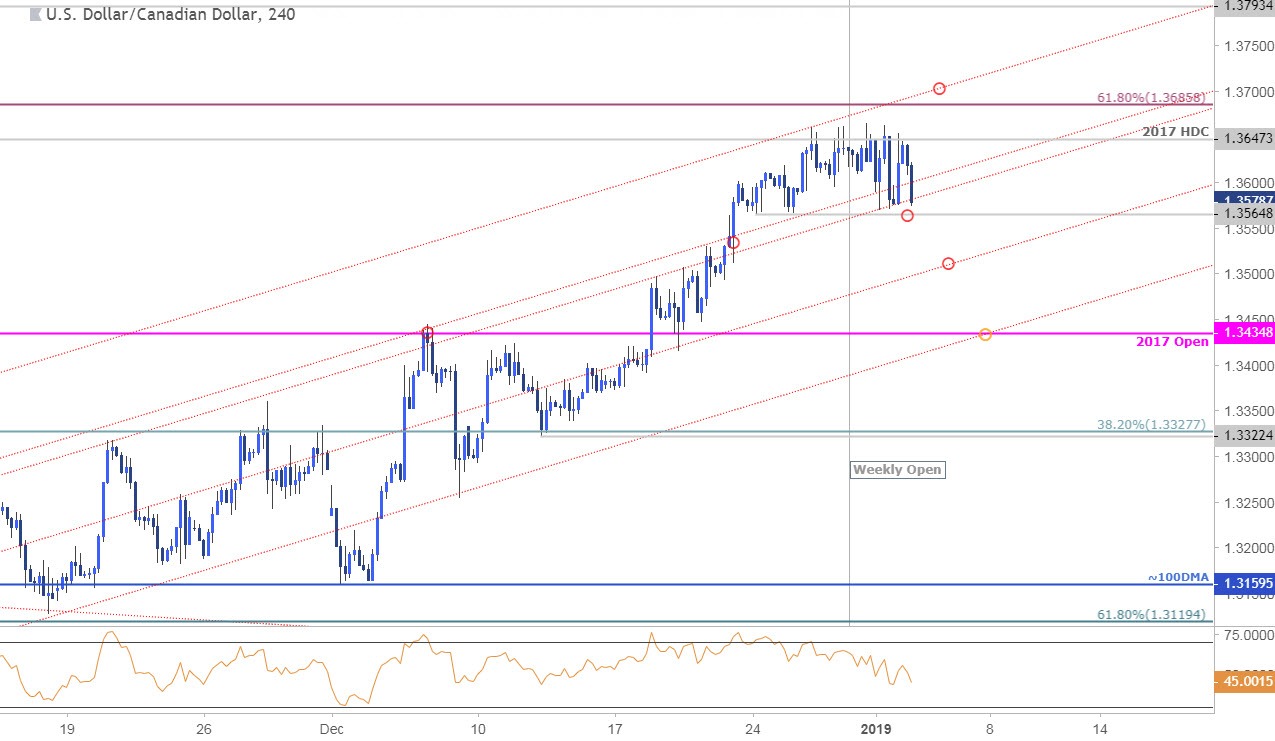
Notes: A closer look at price action highlights the October channel with USD/CAD carving out a weekly opening-range just below slope resistance. A break below 1.3565 would risk a deeper pullback here targeting the lower parallels at ~1.35 and 1.3535- look for a bigger reaction there for guidance IF reached. A breach above channel resistance would be needed to mark the resumption of the broader uptrend targeting subsequent topside objectives at 1.3793.
Bottom line: The USD/CAD rally is vulnerable near-term while below 1.3685. From a trading standpoint, I’ll favor fading weakness while below this region targeting a move towards the lower parallel. Ultimately, a larger setback may offer more favorable long-entries closer to daily slope support.
USD/CAD TRADER SENTIMENT
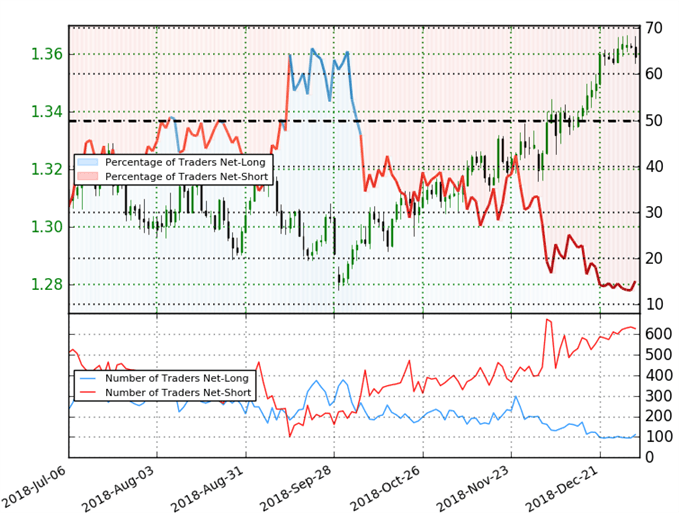
- A summary of IG Client Sentiment shows traders are net-short USD/CAD - the ratio stands at -----5.64 (15.1% of traders are long) – bullish reading
- Traders have remained net-short since October 9th; price has moved 4.2% higher since then
- Long positions are15.6% higher than yesterday and 5.7% higher from last week
- Short positions are 0.8% lower than yesterday and 2.0% higher from last week
- We typically take a contrarian view to crowd sentiment, and the fact traders are net-short suggests USD/CAD prices may continue to rise. Yet traders are less net-short than yesterday and compared with last week. Recent changes in sentiment warn that the current USD/CAD price trend may soon reverse lower despite the fact traders remain net-short.
Disclosure: Do you want to see how retail traders are currently trading the US Dollar? Check out our IG Client Sentiment ...
more

