
USD/CAD Forecast: RSI Sell Signal Emerges Ahead Of Fed Symposium
USD/CAD appears to have reversed course following the failed attempt to test the December 2020 high (1.3009), and the exchange rate may face a larger correction if Chairman Jerome Powell and Co. endorse a wait-and-see approach ahead of the next quarterly meeting in September.
However, the break above the 2021 opening range indicates a potential change in the broader trend as an inverse head-and-shoulders formation takes shape, and speculation for a looming shift in Fed policy may keep USD/CAD afloat as a growing number of central bank officials show a greater willingness to scale back monetary support.
As a result, the Fed symposium may produce a bullish reaction in the US Dollar if Federal Reserve officials lay out a potential exit strategy, and the Greenback may continue to outperform its Canadian counterpart as the Bank of Canada (BoC) “now expects GDP growth of around 6 percent in 2021 – a little slower than was expected in April.”
In turn, USD/CAD may continue to appreciate ahead of the next BoC interest rate decision on September 8 as Governor Tiff Macklem and Co. insist that “the recovery continues to require extraordinary monetary policy support, but a further advance in the exchange rate may fuel the recent flip in retail sentiment as traders turn net-short for the second time this year.
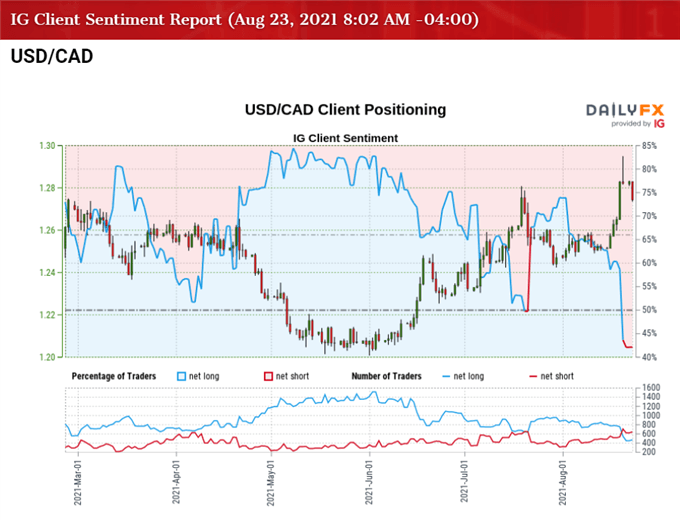
The IG Client Sentiment Report shows 42.07% of traders are currently net-long USD/CAD with the ratio of traders short to long standing at 1.38 to 1.
The number of traders net-long is 9.94% higher than yesterday and 41.83% lower from last week, while the number of traders net-short is 8.51% higher than yesterday and 49.47% higher from last week. The decline in net-long position comes as USD/CAD extends the decline from the fresh yearly high (1.2949), while the jump in net-short interest has fueled the shift in retail sentiment as 65.48% of traders were net-long the pair on August 10.
With that said, the break above the January high (1.2881) may continue to indicate a change in the broader trend as an inverse head-and-shoulders formation takes shape, but the failed attempt to test the December 2020 high (1.3009) may generate a larger pullback in USD/CAD as the Relative Strength Index (RSI) falls back from overbought territory.
USD/CAD RATE DAILY CHART
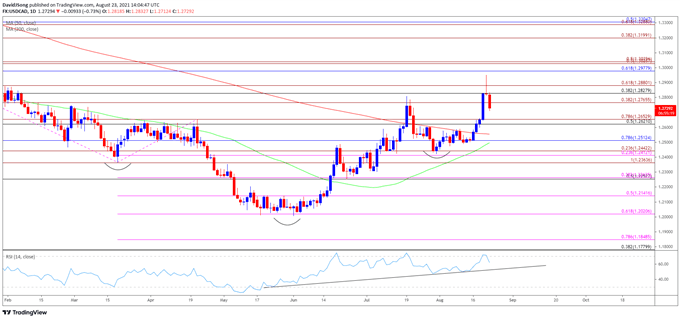
Source: Trading View
- There appears to be a shift in the broader trend as USD/CAD clears the January high (1.2881), and the exchange rate may continue to trade to fresh yearly highs as an inverse head-and-shoulders formation takes shape.
- The key reversal pattern materialized as the 50-Day SMA (1.2496) developed a positive slope, and with the exchange rate trading above the 200-Day SMA (1.2553) for the first time in a year as Relative Strength Index (RSI) pushed into overbought territory during the same period.
- A textbook sell signal has emerged as the RSI falls back from overbought territory, and USD/CAD may face a larger pullback following the failed attempt to test the December 2020 high (1.3009) as it slips back below the 1.2770 (38.2% expansion) region.
- In turn, the pullback from the fresh yearly high (1.2949) may push USD/CAD towards the Fibonacci overlap around 1.2620 (50% retracement) to 1.2650 (78.6% expansion), with the next area of interest coming in around 1.2510 (78.6% retracement).
- Need a close above the overlap around 1.2830 (38.2% retracement) to 1.2880 (61.8% expansion) to bring the 1.2980 (61.8% retracement) region back on the radar, with a move above the December 2020 high (1.3009) opening up the 1.3030 (50% expansion) to 1.3040 (50% expansion) area.
Disclosure: See the full disclosure for DailyFX here.


