
USD/CAD Downtrend Continuation Below The M Pattern
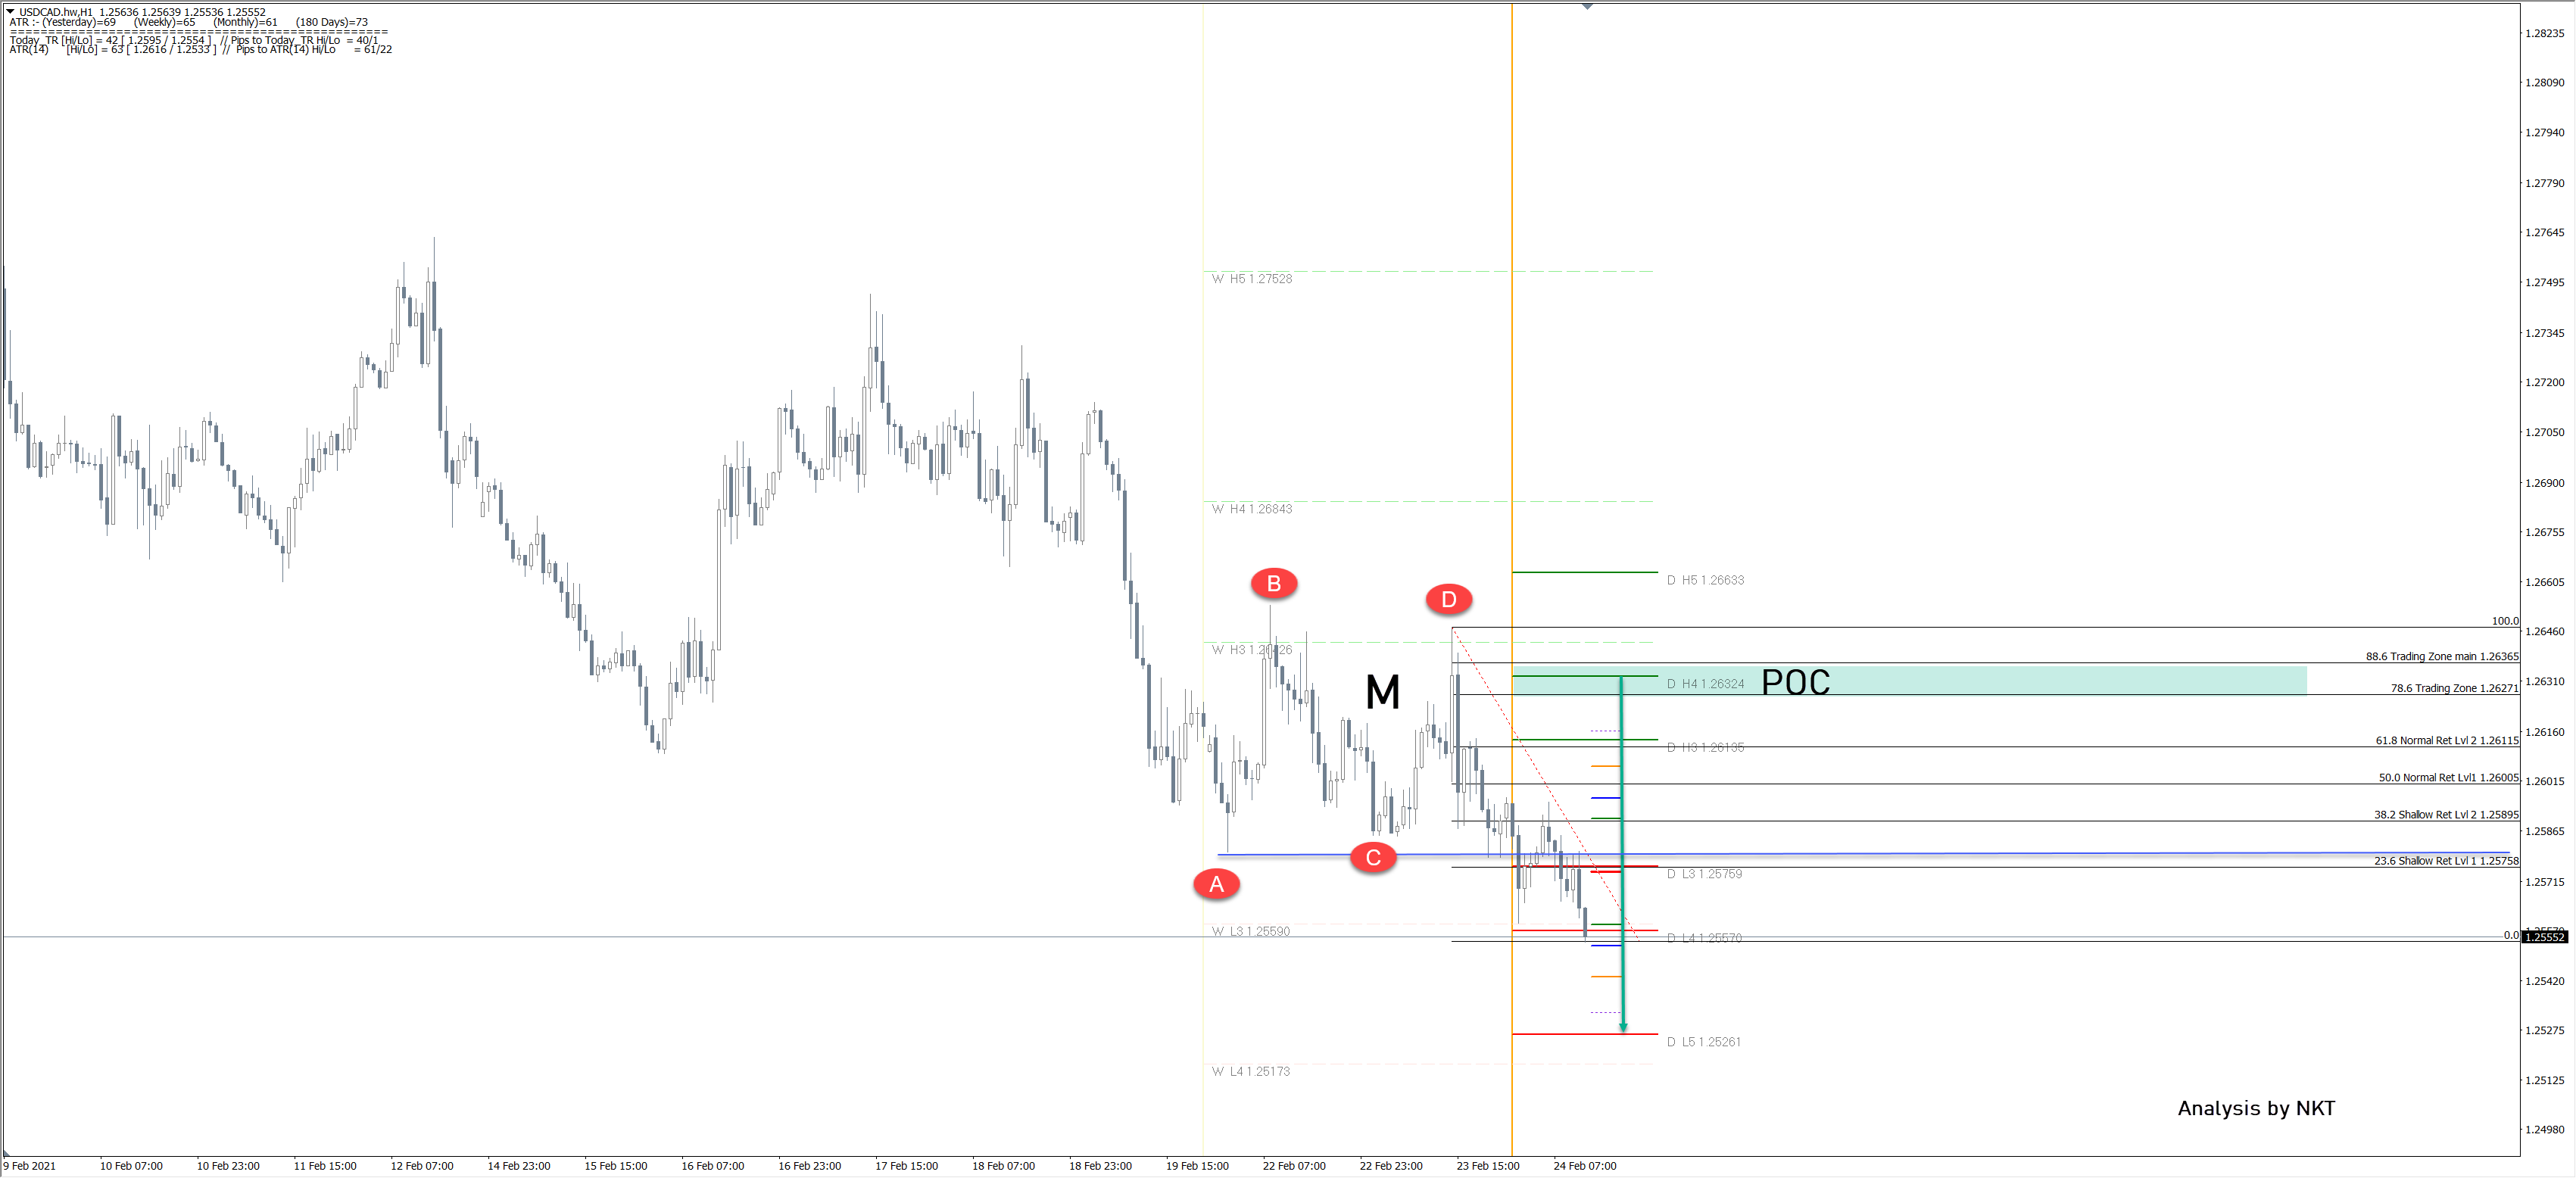
The USD/CAD is bearish and we can even spot the M pattern at support. New lows are expected.

The M pattern is shown as the ABCD and point C is where the breakout has happened. We should see a continuation move lower to D L4 and below W L3 – 1.2559. If the price continues further down 1.2526 is the final target. We could see a retracement to the POC zone too. In that case 1.2627-1.2636 is the zone where the expected rejections should happen.
(Click on image to enlarge)
Disclaimer: CFDs are complex instruments and come with a high risk of losing money rapidly due to leverage. On average around 80% of retail investor accounts loose money when trading with high ...
more
How did you like this article? Let us know so we can better customize your reading experience.

Comments
Leave a comment to automatically be entered into
our contest to win a free Echo Show.

