
USD Price Outlook: US Dollar Ripping Higher As Markets Swoon
The US Dollar is gaining considerable ground to start the week as stocks slide further. USD price action tends to rise during periods of risk aversion due to its posturing as a top safe-haven currency. This is boosting the DXY Index as the US Dollar strengthens across the board of major FX peers like the EUR, GBP, CAD, and AUD to name a few.
US DOLLAR INDEX PRICE CHART: DAILY TIME FRAME (23 APR TO 21 SEP 2020)
(Click on image to enlarge)
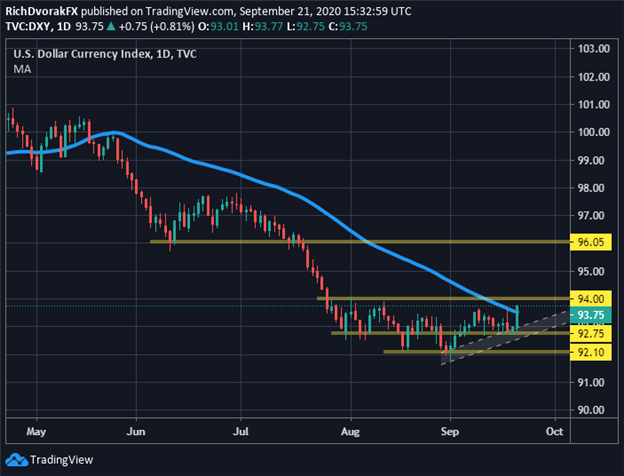
Chart created by @RichDvorakFX with TradingView
The latest advance set forth by the broader US Dollar Index reinforces the 92.75-price level as an area of buoyancy, which was a key technical support level identified in last week’s FOMC preview. The steep ascent also puts the broader US Dollar on pace to close above its 50-day moving average.
This brings to focus an inverse head and shoulder chart pattern possibly under development, which could signal a bottom is in place for the US Dollar if confirmed. A move by the DXY Index above the 94.00-handle might validate a neckline break and indicate more upside potential for USD price action.
US DOLLAR INDEX PRICE CHART WITH VIX ‘FEAR-GAUGE’ OVERLAID: DAILY TIME FRAME (23 APR TO 21 SEP 2020)
(Click on image to enlarge)
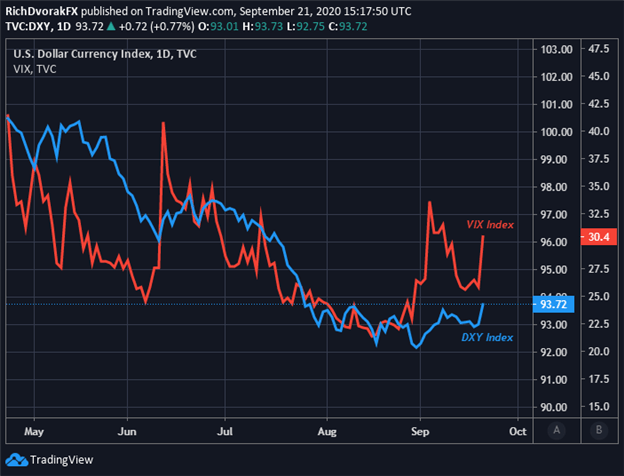
Chart created by @RichDvorakFX with TradingView
That said, with rising risk aversion standing out as a primary catalyst helping steer the US Dollar higher, the DXY Index could extend its advance alongside the S&P 500 VIX Index, or fear-gauge. If expected market volatility reverts back lower, however, so too could USD price action. Looking ahead, the DailyFX Economic Calendar highlights several risk events and data releases on the docket this week with the potential of weighing materially on USD price action.
USD PRICE OUTLOOK: US DOLLAR IMPLIED VOLATILITY TRADING RANGES (1-WEEK)
(Click on image to enlarge)
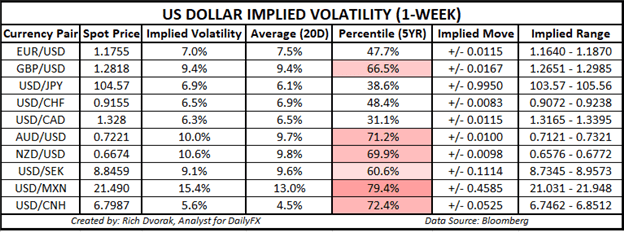
Expected commentary from Fed Chair Powell and the release of global PMI data stand out in particular. The prospect of more monetary intervention from the Federal Reserve could weigh negatively on the US Dollar, but potentially disappointing PMI reports stand to fuel an aggressive breakdown in market sentiment. Options-implied trading ranges are calculated using 1-standard deviation (i.e. 68% statistical probability price action is contained within the implied trading range over the specified time frame).


