
USD Index: Bigger Correction Seems Over; Maybe A Turning Point In View
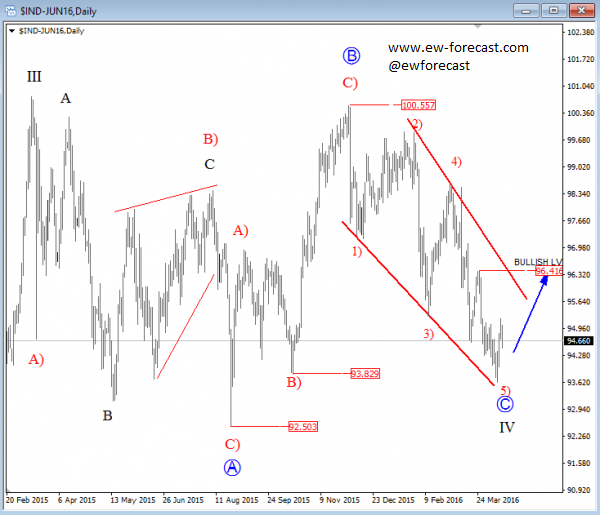
On USD index daily chart we are observing a big sideways, slow and overlapping price action which is a personality of a contra-trend movement. We are observing a flat patter in black wave IV. It's a three wave pattern where final subwave, wave C should be made by five waves. Well, we can see nice decline from end of 2015 that can be an ending diagonal. That's a reversal pattern which may send price into a strong bullish mode in the second part of this year, after price recovers back above 96.40.
USD Index, Daily
Disclosure: None.
How did you like this article? Let us know so we can better customize your reading experience.

Comments
Leave a comment to automatically be entered into
our contest to win a free Echo Show.

