
USD Finds Short-Term Positive Flows
Narrative In Financial Markets
- The US Dollar has been recovering some of its strength, as our RORO model shows, mainly led by an improving outlook on the economy short-term on rising US NFP, US ISM last Friday.
- The RBA surprises the market, judging by the spike in the AUD, by sounding more neutral than one would have anticipated in light of the mounting negative fundamentals in Australia.
- Inconsequential and light US data flow during Monday, alongside no immediate resolution in the US vs China trade negotiations, has market searching for fresh drivers.
- German Chancellor Angela Merkel encourages key actors to resort to creative ways to unravel the present impasse on the Brexit situation between the UK and the EU.
RORO Model: Risk-On Risk-Off Conditions
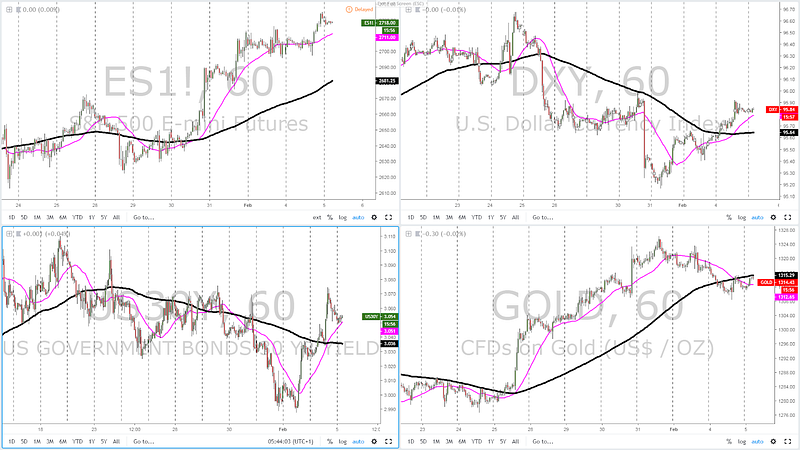
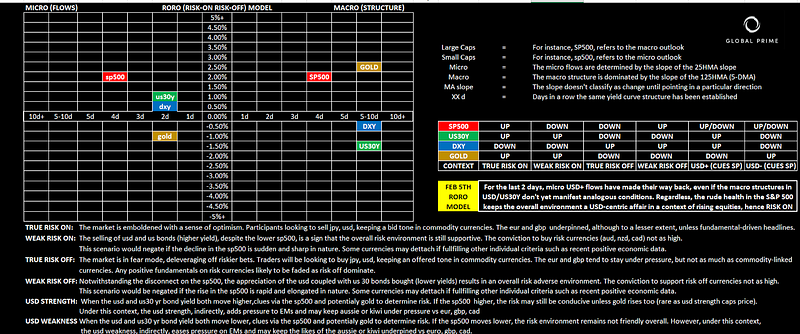
For the last 2 days, micro USD+ flows have made their way back, even if the macro structures in USD/US30Y don’t yet manifest analogous conditions. Regardless, the rude health in the S&P 500 keeps the overall environment a USD-centric affair in a context of rising equities, hence prevailing ‘risk on’ conditions are still in place, which should keep the JPY on the back foot.
Yield Curve: Outlook For Growth, Inflation & Policies
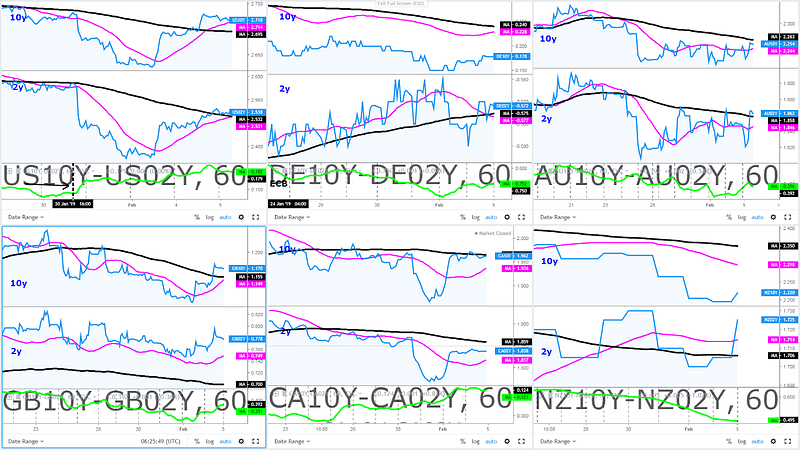
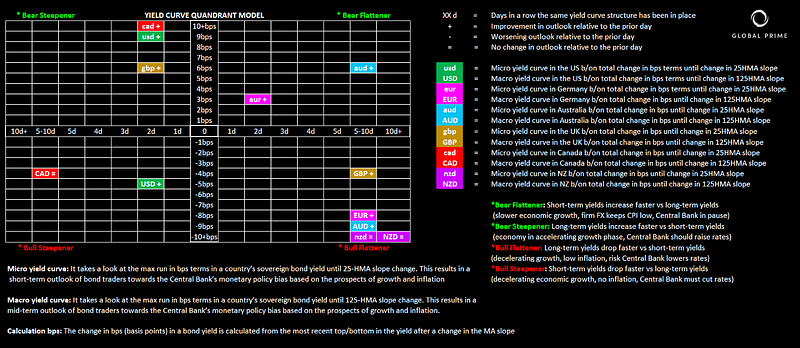
The US and the Canadian Dollar are the currencies benefiting the most from the exodus in fixed income since the upbeat economic data in the US last Friday. Both countries’ government bonds are exhibiting bear steepener dynamics, which sets out a short-term positive backdrop. However, the macrostructure in both countries still carries negative connotations since the FOMC dovish turn. There has definitely been some decent recovery by both the USD, CAD as the market turns slightly more constructive short-term. Out of a bad neighborhood, looks like they are the best houses.
New Zealand bond yields, by any measure (short or long term), remain largely depressed. It’s also interesting to note that macro-wise, all countries remain in negative yield curve phases, in other words, the outlook towards tighter monetary policies is nowhere to be found.
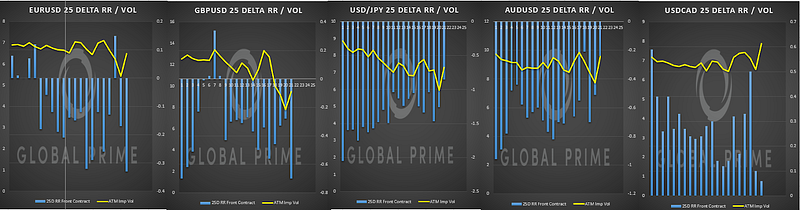
Options — 25 Delta RR & Vols
According to vol skews, option traders are expecting further downward pressure in the EUR/USD, GBP/USD, and a continuation of the upside bias in USD/JPY. Meanwhile, the commodity currencies (AUD, CAD) are facing a slightly better outlook judging by the reduction in put premiums.
Important Footnotes
- Risk model: The fact that financial markets have become so intertwined and dynamic makes it essential to stay constantly in tune with market conditions and adapt to new environments. This prop model will assist you to gauge the context that you are trading so that you can significantly reduce the downside risks. To understand the principles applied in the assessment of this model, refer to the tutorial How to Unpack Risk Sentiment Profiles
- Cycles: Markets evolve in cycles followed by a period of distribution and/or accumulation. The weekly cycles are highlighted in red, blue refers to the daily, while the black lines represent the hourly cycles. To understand the principles applied in the assessment of cycles, refer to the tutorial How To Read Market Structures In Forex
- POC: It refers to the point of control. It represents the areas of most interest by trading volume and should act as walls of bids/offers that may result in price reversals. The volume profile analysis tracks trading activity over a specified time period at specified price levels. The study reveals the constant evolution of the market auction process. If you wish to find out more about the importance of the POC, refer to the tutorial How to Read Volume Profile Structures
- Tick Volume: Price updates activity provides great insights into the actual buy or sell-side commitment to be engaged into a specific directional movement. Studies validate that price updates (tick volume) are highly correlated to actual traded volume, with the correlation being very high, when looking at hourly data. If you wish to find out more about the importance tick volume, refer to the tutorial on Why Is Tick Volume Important To Monitor?
- Horizontal Support/Resistance: Unlike levels of dynamic support or resistance or more subjective measurements such as fibonacci retracements, pivot points, trendlines, or other forms of reactive areas, the horizontal lines of support and resistance are universal concepts used by the majority of market participants. It, therefore, makes the areas the most widely followed and relevant to monitor. The Ultimate Guide To Identify Areas Of High Interest In Any Market
- Trendlines: Besides the horizontal lines, trendlines are helpful as a visual representation of the trend. The trendlines are drawn respecting a series of rules that determine the validation of a new cycle being created. Therefore, these trendline drawn in the chart hinge to a certain interpretation of market structures.
- Correlations: Each forex pair has a series of highly correlated assets to assess valuations. This type of study is called inter-market analysis and it involves scoping out anomalies in the ever-evolving global interconnectivity between equities, bonds, currencies, and commodities. If you would like to understand more about this concept, refer to the tutorial How Divergence In Correlated Assets Can Help You Add An Edge.
- Fundamentals: It’s important to highlight that the daily market outlook provided in this report is subject to the impact of the fundamental news. Any unexpected news may cause the price to behave erratically in the short term.
- Projection Targets: The usefulness of the 100% projection resides in the symmetry and harmonic relationships of market cycles. By drawing a 100% projection, you can anticipate the area in the chart where some type of pause and potential reversals in price is likely to occur, due to 1. The side in control of the cycle takes profits 2. Counter-trend positions are added by contrarian players 3. These are price points where limit orders are set by market-makers. You can find out more by reading the tutorial on The Magical 100% Fibonacci Projection
The Daily Edge is authored by Ivan Delgado, Head of Market Research at Global Prime. The purpose of this content is to provide an assessment of the market conditions. The report takes an in-depth ...
more

