
US30 Uptrend Resumes After Bullish Breakout And Aims At $35k
The Dow Jones Index (US30) is back in the uptrend after a lengthy sideways correction.
As mentioned in our previous analysis, the correction turned out to be a wave 4pattern (green) which respected the shallow Fibonacci levels. Let’s analyze what to expect next.
Price Charts and Technical Analysis

The US30 daily chart has 7 daily candles that were unable to break for a higher high. This certainly indicates a small pauze and indecision within the uptrend:
- However, the moving averages are indicating that the uptrend remains strong. The 21 ema zone is showing a steep angle. Plus the gaps between all of the moving averages are only increasing (purple arrow).
- Price action seems to be in a wave 5 (pink) of a larger uptrend (wave 3 purple) after completing an ABC (grey) in wave (pink).
- The current push-up could be part of waves 3 as long as price action keeps respecting the daily 21 emas. This could occur via a breakout (blue arrow) or after a pullback (orange arrow) and bounce (green arrow).
- A break and close below the 21 ema (orange pauze circle) could indicate the end of the wave 5 (pink) whereas a break below the support (red stop circle) makes it likely.
- That said, a strong bearish retracement only invalidates the waves 3 but not the entire uptrend because price action could still bounce at the 144 – 233 emas.
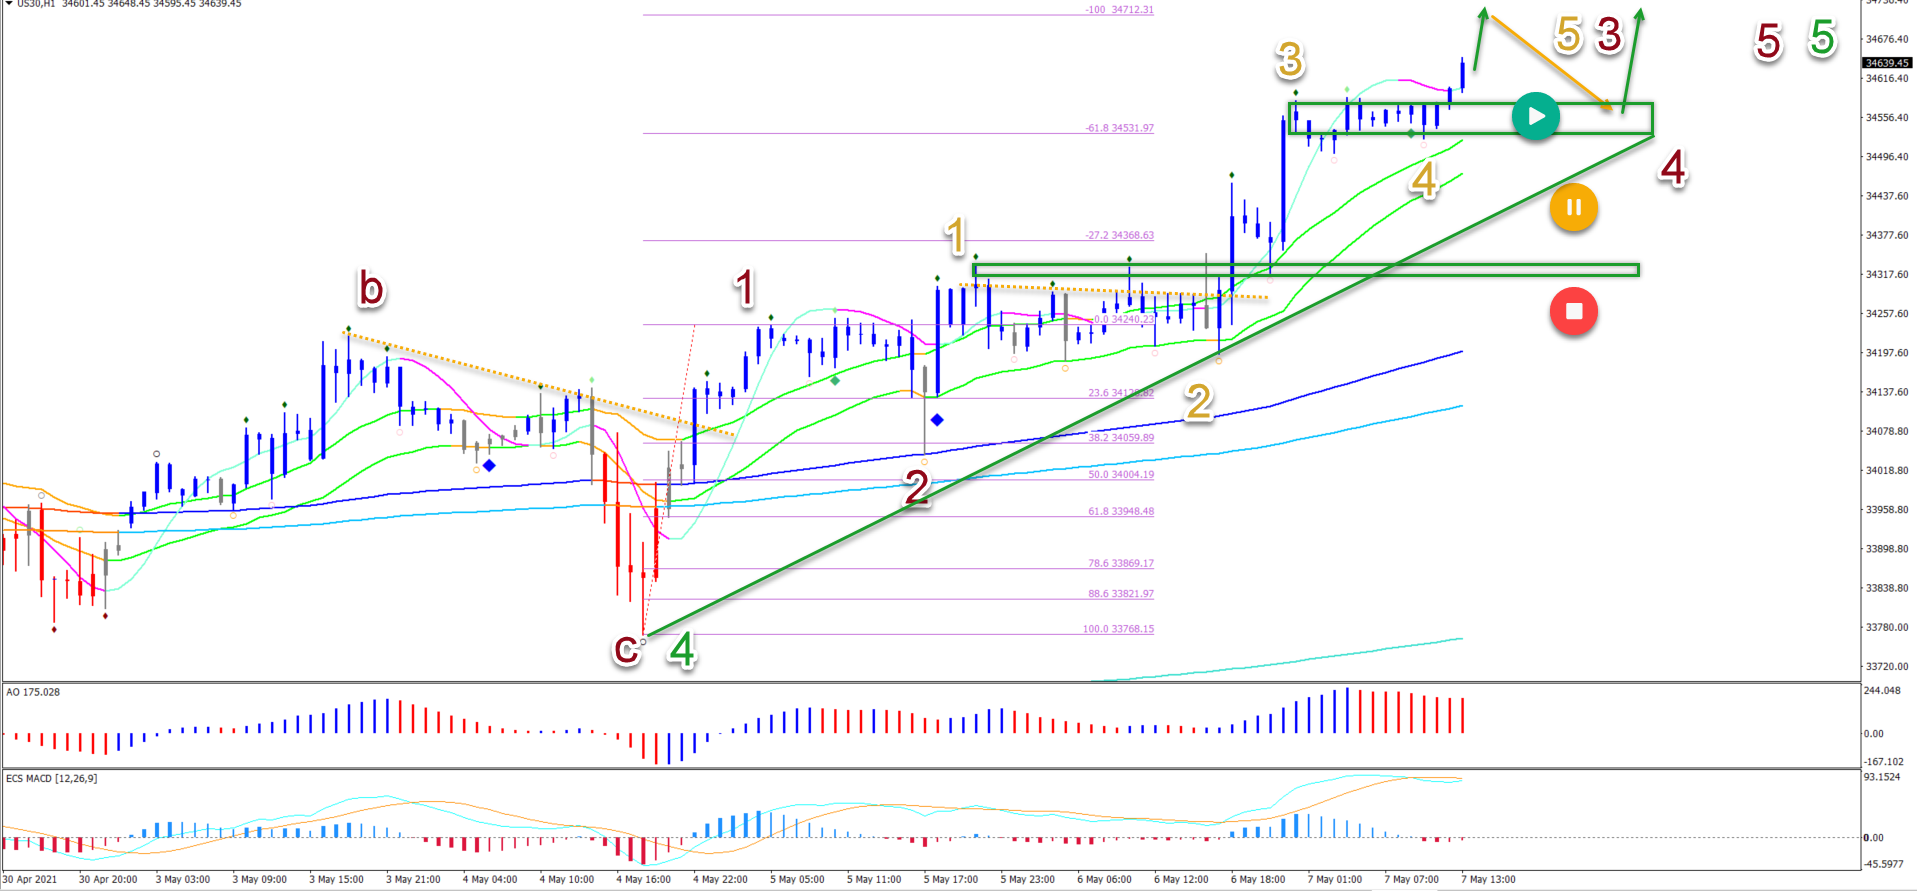
On the 4 hour chart, we can see the bullish wave outlook if the pullback is shallow and the waves 3 remain valid:
- The current sideways price action is probably part of wave 4 (green).
- A larger bearish ABC (black) pattern is expected within wave 4 (green).
- The break below the 21 ema zone (orange arrow) could confirm the wave C.
- A retracement lower will probably aim at the 23.6% and 38.2% Fibonacci levels.
- A bear flag (grey arrow) could indicate a deeper push lower (orange arrow).
- A bullish bounce (blue arrows) at these Fib levels could indicate the end of 4 (green).
- Only a break below the 50% Fib places this on hold (orange) or invalidates it (red).
Disclaimer: CFDs are complex instruments and come with a high risk of losing money rapidly due to leverage. On average around 80% of retail investor accounts loose money when trading with high ...
more
How did you like this article? Let us know so we can better customize your reading experience.

Comments
Leave a comment to automatically be entered into
our contest to win a free Echo Show.

