
US Stocks Led Most Global Markets Higher Last Week
Equities in the United States edged out the rest of the world for the trading week’s performances ended Friday, Nov. 1, based on a set of exchange-traded funds that represent the major asset classes.
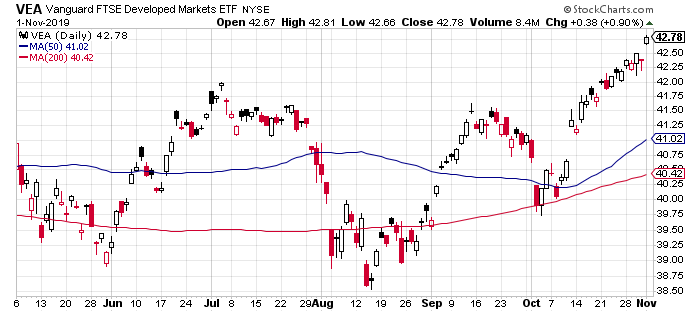
In a week that witnessed rallies in most of the global markets, Vanguard Total US Stock Market (VTI) took the lead over the rest of the field. VTI rose 1.6%, or slightly ahead of last week’s second-best performer: foreign stocks in developed markets via Vanguard FTSE Developed Markets (VEA), which climbed 1.4%.
The top-performing bullish momentum in the US is also conspicuous on a longer-term basis relative to the rest of the world, The Wall Street Journal notes today. “Global stocks are lagging behind US shares, illustrating how investors’ faith in the domestic economy continues to drive a growing divergence in financial markets,” the Journal reports.
Foreign equities, however, are playing catch-up lately. Although VEA lags VTI this year, over the last month foreign stocks in developed markets have outpaced US shares by a small margin. A strong rally in VEA on Friday lifted the fund to its highest close in well over a year.
Among the handful of asset class losers last week, government debt in emerging markets posted the deepest loss. VanEck Vectors JP Morgan EM Local Currency Bond (EMLC) slipped fractionally, dipping 0.1%.
The broad-based rally continued to lift an ETF-based version of the Global Market Index (GMI.F). This unmanaged benchmark, which holds all the major asset classes (except cash) in market-value weights, rose 1.2% last week – a strong gain that marks the index’s fourth straight weekly advance.

For the one-year profile, US real estate investment trusts continued to lead the major asset classes by a comfortable margin. Vanguard Real Estate (VNQ) was up 24.8% on a total return basis for the trailing one-year window at Friday’s close (based on trailing 252 trading days).
Broadly defined commodities remain in last place for the one-year change. The iShares S&P GSCI Commodity-Indexed Trust (GSG) has lost 8.5% over the past year.
Meanwhile, GMI.F’s trailing one-year period has accelerated recently and the benchmark is now up a sizzling 12.9% vs. the year-ago level after factoring in distributions.

Reviewing all the ETFs listed above through a momentum lens continues to reflect a strong upside bias in most markets. The analysis is based on two sets of moving averages. The first compares the 10-day moving average with its 100-day counterpart — a proxy for short-term trending behavior (red line in chart below). A second set of moving averages (50 and 200 days) represent the intermediate measure of the trend (blue line). At Friday’s close, a bullish tailwind was priced into nearly every component of the major asset classes.

Disclosure: None.


