
US Stock Market Weekly Update November 18-November 22, 2019
A small decline for the US stock market this week, but all major US stock market indices remain very close to their 52-week highs. For the week of November 18-November 22, 2019 major US stock market indices closed as follows:
- Dow Jones Industrial Average: Close 27875.62, -0.46% for the week
- S&P 500 Index: Close 3110.29, -0.33% for the week
- NASDAQ: Close 8519.88, -0.25% for the week
- Russell 2000: Close 1588.94, -0.47% for the week
Overall volatility was low for the week with the market focusing on both earnings reports and anticipated news from the US-China trade war developments and a potential trade deal.
Weekly Stocks Gainers
These are the top 3 gainers, stocks with 5 days of consecutive price advances:
- Stage Stores (NYSE:SSI), Close 4.66, 5-day change +116.74%
- Fulcrum Therapeutics Inc (NASDAQ:FULC), Close 14.02, 5-day change +75.25%
- Osmotica Pharmaceuticals Plc (NASDAQ:OSMT), Close 6.06.15, 5-day change +47.09%
Weekly Stocks Losers
These are the top 3 losers, stocks with 5 days of consecutive price declines:
- Danaos Corp (NYSE:DAC), Close 5.69, 5-day change -48.27%
- Bio-Path Holdings (NASDAQ:BPTH), Close 7.51, 5-day change -29.58%
- Igm Biosciences Inc (NASAD:IGMS), Close 20.06, 5-day change -28.74%
Stock Market Commentary
On November 19, 2019 the monthly Building Permits for the month of October 2019 were released beating the expectations, the actual figure was 5.0% versus a forecast of -0.8%. However, on the same day the Housing Starts figure for the month of October 2019 was 3.8%, less than the forecast of 4.9%. Some mixed signals about the Real Estate market. On November 22, 2019 there were a lot of important economic indicators released, the PMIs for the manufacturing and services sectors and the University of Michigan's consumer sentiment figure. Both the Markit US Manufacturing PMI, and the Markit US Services PMI beat expectations, with figures of 52.2 and 51.6 respectively, compared to the forecasts of 51.4 and 51.0 respectively. Any figure above the 50.0 level shows expansion for the manufacturing and services sectors. The University of Michigan Sentiment Index was also better than expected, with a reading of 96.8 compared to the forecast of 95.7.
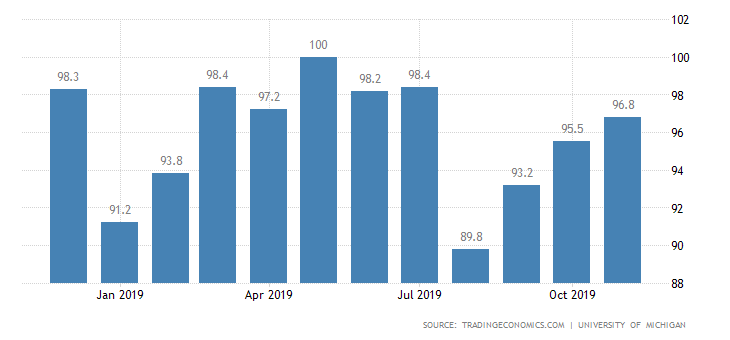
University of Michigan Sentiment Index
“The University of Michigan's consumer sentiment for the US was revised higher to 96.8 from 95.7 in November of 2019 and compared with 95.5 in October. It is the highest reading in four months, nearly close to the average of 97 since the start of 2017. Consumer expectations improved and the current conditions subindex declined less than initially anticipated. “, Source: Trading Economics
From the above chart we note that there US consumer sentiment is increasing for the past four consecutive months, and consumer confidence is highly correlated with consumer spending and ultimately the gross domestic product (GDP) growth of the economy.
Sources:
https://www.dailyfx.com/economic-calendar
https://quotes.wsj.com/index/US/COMP
https://www.barchart.com
Disclosure: I have no position in any stock mentioned


