
U.S. Residential Real Estate Market Peaked In March 2018
As best as we can tell, the residential real estate market in the U.S. peaked in March 2018, where since that month, it has declined in 34 of 41 states for which we have recent price and sales data.
That's going by our estimate for the total aggregate value of transactions for existing home sales, which covers somewhere around 87-90% of all home sales in the U.S. economy. Using monthly sales and price data from Zillow, we estimate that this figure has fallen from $129.8 billion in March 2018 to $120.4 billion in November 2018, the last month for which estimates for 40 states and the District of Columbia are covered by Zillow's database is available. That change would mark a decline of 7% nationally.

The following chart shows our estimates of the total aggregate value of transactions for existing home sales for the Top 5 states for this measure from January 2009 through December 2018.
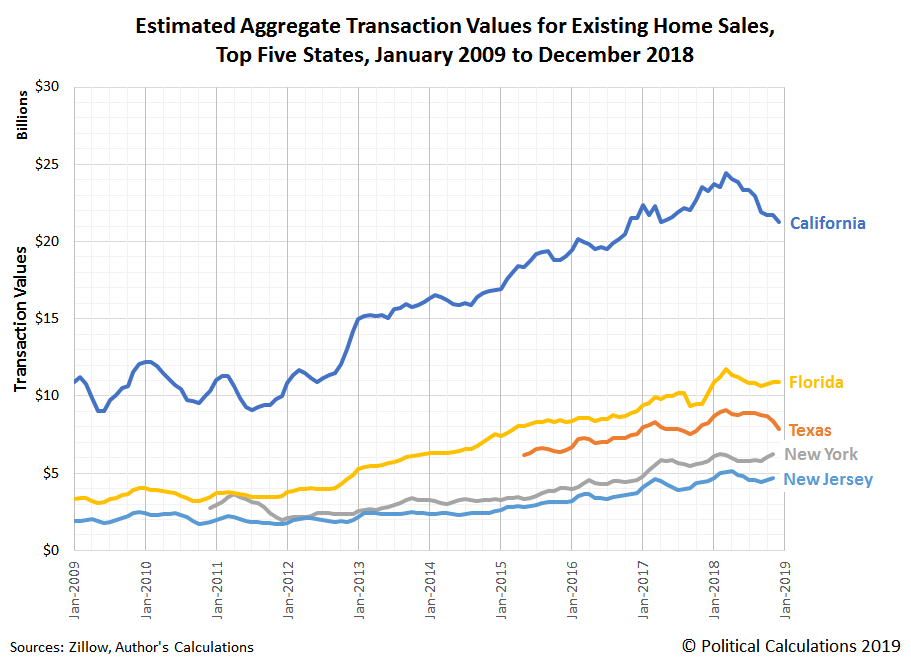
Three of these states marked a peak in March 2018, with the following declines through December 2018's initial estimates: California (-13%), Florida (-7%), and Texas (-13%). New Jersey peaked in April 2018, having since declined by 9% through November 2018, the last month for which its data was available. New York appears to have set a new peak in November 2018, following a shallow dip after having previously peaked in February 2018.
Looking closer at California, the total value of existing home transactions in that state fell from $24.4 billion in March 2018 to $21.6 billion in November 2018, accounting for nearly 30% of the national decline through those months. This large share is mainly attributable to the very large size of California's real estate market. The initial estimate for California's aggregate existing home sales for December 2018 is $21.2 billion.
Getting under the hood for California's existing home sales, Zillow's seasonally adjusted data indicates that the number of sales in the state has been declining since peaking over 43,000 in January 2017, falling to 41,000 in January 2018, and down more significantly to 36,000 through the end of 2018. The seasonally adjusted median sale price of existing homes in the state over that time went from $425,000 in January 2017, up to $471,000 in January 2018, which continued to rise until peaking at $491,000 in November 2018. Compared to 2017, prices were no longer rising fast enough to cover the decline in sales that drove down the aggregate valuation of the state's real estate market in 2018.
The combination of rising prices and falling sales numbers indicates that a relative decrease in the supply of affordable homes is behind the change. Contributing to the increased cost of home ownership in the U.S, particularly after March 2018, was the increase in mortgage interest rates from an average of 3.99% in 2017 to 4.54% in 2018, the highest 30-year conventional mortgage rates have been since 2010. The increase in mortgage rates has been heavily influenced by the Federal Reserve's quantitative tightening policies, where the central bank has been seeking to increase the cost of borrowing for Americans directly by boosting short term interest rates and indirectly by shrinking its holdings of U.S. Treasuries and Mortgage Backed Securities.
On the demand side, other contributing factors may be related to more global concerns, where 2018 saw a considerable slowdown in China's economy. That kind of economic deceleration would reduce the number of Chinese citizens seeking to acquire U.S. real estate, which could represent up to 25% of some local market real estate transactions.
Other states have seen bigger percentage declines in sales than California and Texas, where Zillow's data identifies the real estate markets of Arizona, Colorado, Connecticut, Illinois, Louisiana, North Dakota, Oregon, and Washington as heavily hit.
Elsewhere on the Interwebs
- Housing Bear Who Called 2018 Slowdown Says Worst Yet to Come
- Americans stopped buying homes in 2018, mortgage lenders are getting crushed, and an economic storm could be brewing
- Bank Of America Calls It: "The Peak In Home Sales Has Been Reached; Housing No Longer A Tailwind"(September 2018)
References
Zillow Research. Home Listings and Sales: Median Sale Price, Seasonally Adjusted, State. [CSV Data]. Accessed 25 January 2019.
Zillow Research. Home Listings and Sales: Monthly Home Sales, Number, Seasonally Adjusted, State. [CSV Data]. Accessed 25 January 2019.
Political Calculations. Median and Average New Home Sale Prices. [Online Article]. 18 January 2019.
Disclaimer: Materials that are published by Political Calculations can provide visitors with free information and insights regarding the incentives created by the laws and policies described. ...
more

