
U.S. New Home Sales Market Cap Continues Shrinking
New home sales in the U.S. continued their negative growth trajectory in January 2019, the data for which was finally published last week after having been delayed by the partial U.S. government shutdown earlier this year.
Since that report came out shortly after we analyzed the relative affordability of new homes sold in the U.S. through the end of December 2018, we thought it might be more worthwhile to look at what that new trend means for U.S. homebuilders (covered by a variety of exchange-traded funds, including BBRE, FREL, FRI, FTY, IARAX, ICF, ITB, IYR, JRS, KBWY, NRO, PKB, PPTY, PSR, RFI, RIF, RNP, RORE, RQI, RWR, SCHH, URE, USRT, VNQ, WREI, XHB, and XLRE, to name just a handful) and the nation's GDP, for which new home sales are a significant contributor.
We've presented the trailing twelve month average for the market cap of new home sales in the U.S. from January 1976 through January 2019 in the following chart, where we confirm that new home sales peaked in March 2018 and have since been on a downward trend, falling back to levels last recorded in late 2016.

The following chart presents the year-over-year growth rate of the trailing twelve month average of the U.S. new home sales market capitalization from January 2000 through January 2019, where we confirm that new home sales in the U.S. have become an economic headwind, showing negative year-over-year growth rates since they last peaked in March 2018.
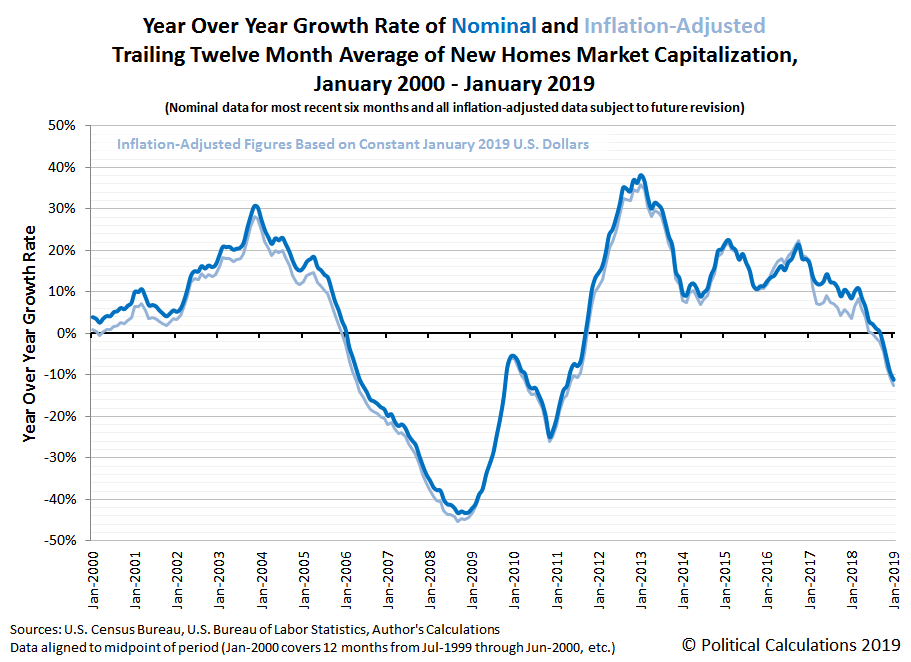
The last time a similar trend existed in the U.S. new home market was shortly after the first housing bubble began deflating in early 2006.
The new residential sales data on which these first two charts are based is limited in that the U.S. Census Bureau only reports national median and average sales prices, while its data for the number of new homes sold is provided nationally and for major regions of the United States. From that data, it appears that the West region of the U.S., which includes Alaska, Arizona, California, Colorado, Hawaii, Idaho, Montana, Nevada, New Mexico, Oregon, Utah, Washington, and Wyoming, is seeing the most significant sales declines, while the Northeast and Midwest are seeing smaller drops, and growing sales in the South region, which have partially offset the declines recorded in the other regions.
Zillow makes its existing homes sales data for many of these states available, however, which provides a better idea of the home sales trends are developing at a more local level, where we can assume that new home sales will generally track along with existing home sales. We've done that for the states in the West region for which Zillow provides data in the following chart.
![]()
Since March 2018, the total aggregate transaction value of existing home sales (the equivalent of market cap) for the West region states covered by Zillow's data has fallen by 14%, with California contributing 58% of the overall decline. The following list reveals that most but not all West region states covered by Zillow's data showed a decline in this measure since March 2018.
- Alaska (-8.4%)
- Arizona (-9.2%)
- California (-15.7%)
- Colorado (-21.1%)
- Idaho (+1.0%)
- Nevada (+2.0%)
- Oregon (-15.5%)
- Utah (-12.1%)
- Washington (-14.3%)
While California has contributed the largest overall decline to the West region's home sales, it has only seen the second largest percentage decline. Colorado's much smaller real estate market has seen the aggregate value of its home sales drop by over 21% since March 2018.
The sales declines follow 30-year conventional mortgage rates rising above 4.2% in February 2018. They had last been at that level in March 2017, which coincidentally marks the peak for when the last significant percentage decline in existing home sales took place in the West region.
After that peak, mortgage rates went on to fall to 3.81% in September 2017, before rising slowly to climb just above the 4% level in January 2018 and then jumping to reach 4.33% in February 2018. Mortgage rates continued to rise until reaching 4.87% in November 2018 and then began to decline once more after the Federal Reserve abruptly changed its established monetary policy of steady, autopilot interest rate hikes at the end of that month.
We'll review the recent trends for home sales in other regions in the near future.
References
U.S. Census Bureau. Census Regions of the United States. [PDF Document]. Accessed 25 April 2016.
U.S. Census Bureau. New Residential Sales Historical Data. Houses Sold. [Excel Spreadsheet]. Accessed 15 March 2018.
U.S. Census Bureau. New Residential Sales Historical Data. Median and Average Sale Price of Houses Sold. [Excel Spreadsheet]. Accessed 15 March 2018.
U.S. Department of Labor Bureau of Labor Statistics. Consumer Price Index, All Urban Consumers - (CPI-U), U.S. City Average, All Items, 1982-84=100 [Online Application]. Accessed 15 March 2018.
Disclaimer: Materials that are published by Political Calculations can provide visitors with free information and insights regarding the incentives created by the laws and policies described. ...
more

